(a)
(b)
(c)
(d)
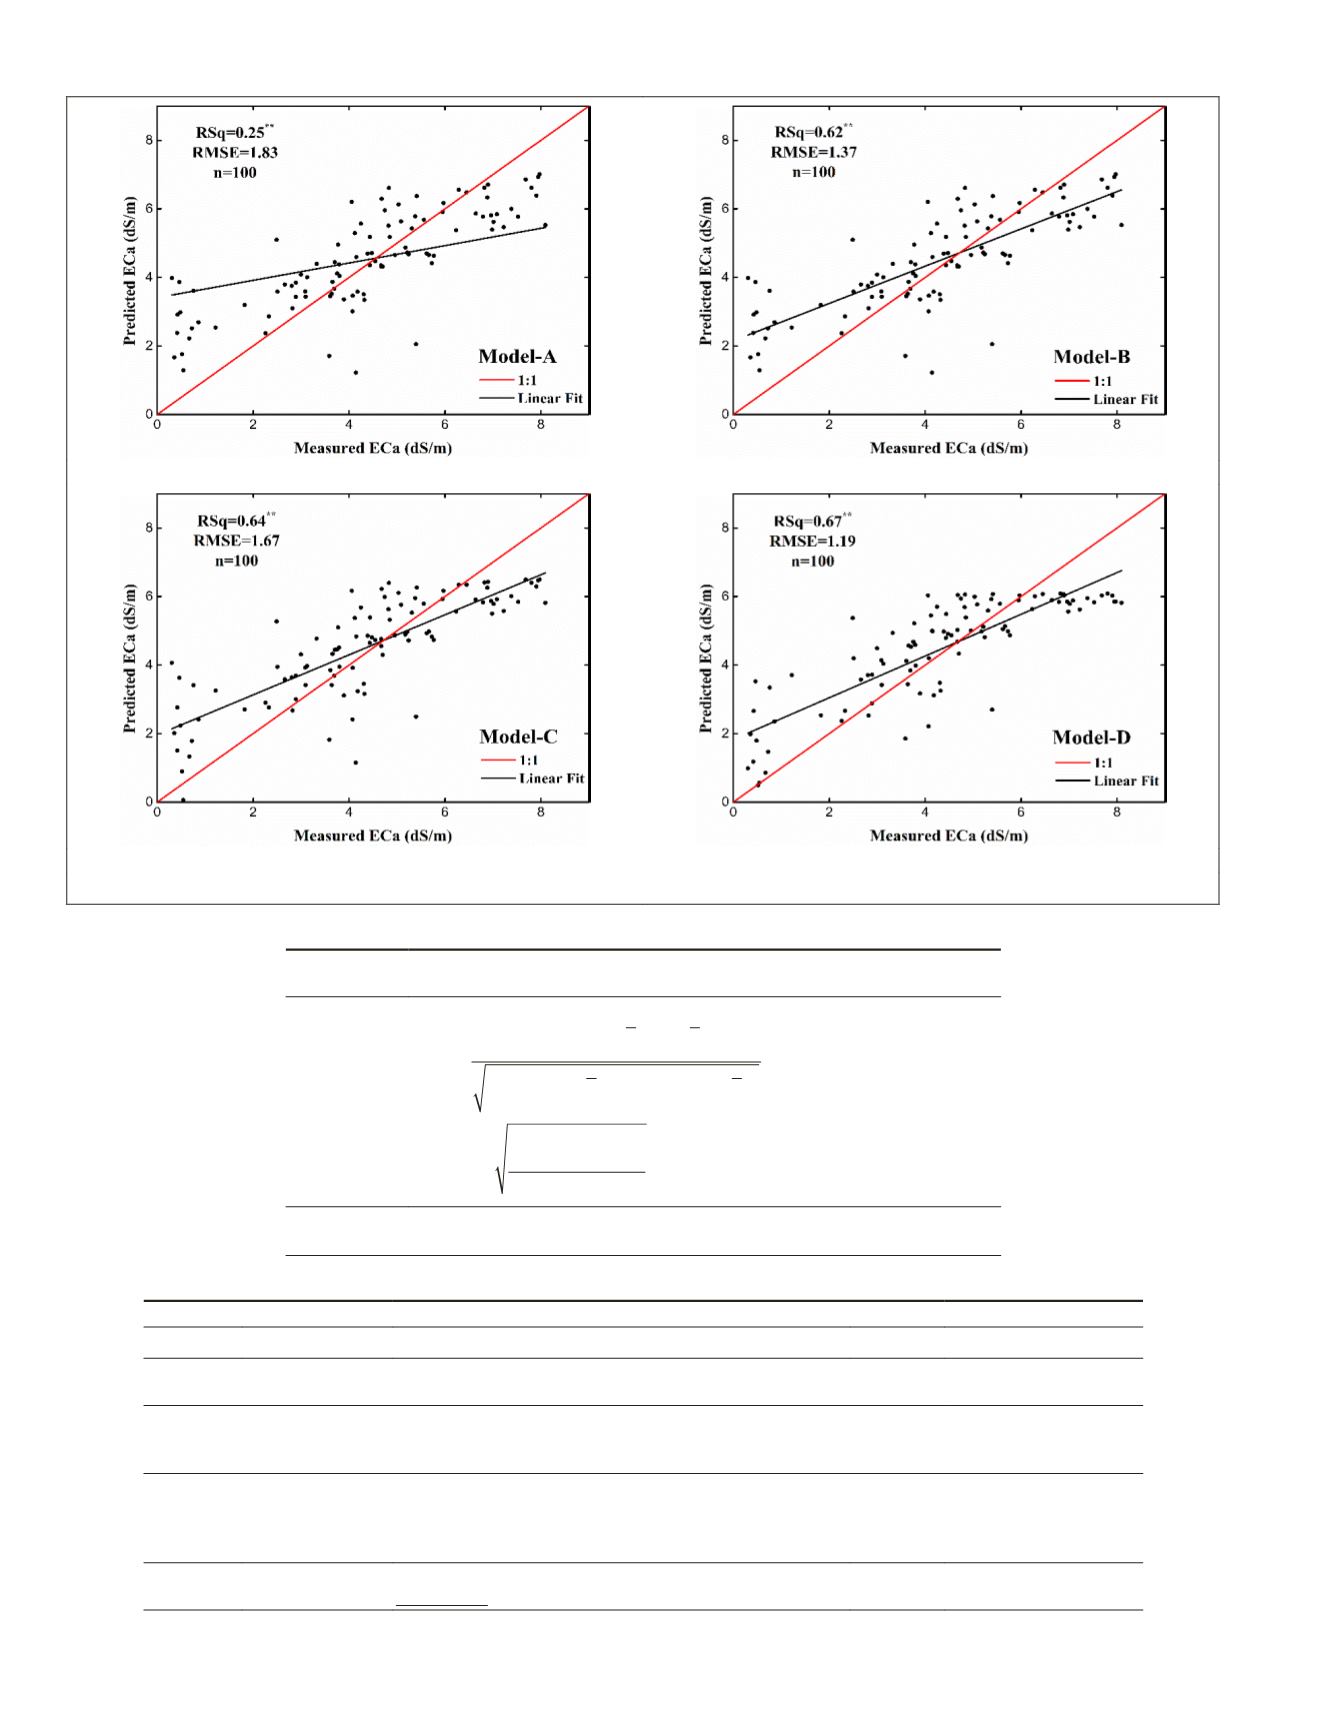
Figure 4. Scatter plots of predicted versus measured
EC
using the developed regression models.
Table 5. Cross-validation metrics.
Function
name
Equation
Coefficient of
determination
R
i
N
i
i
i
N
i
i
N
i
2
1
1
2
1
2
2
=
−
(
)
−
(
)
−
(
)
+
−
(
)
=
=
=
∑
∑ ∑
χ χ γ γ
χ χ
γ γ
RMSE
n
i
N
i
i
=
−
(
)
=
∑
1
2
γ χ
Root mean
square error
Note:
χ
i
and
γ
i
are measured and predicted values, respectively;
χ
– and
γ
– represented the
means measured and predicted values, respectively; and
n
is the number of samples.
Table 6. Developed
PLSR
models to predict
ECa
based on remotely sensed data,
SAVI
index.
Model
Variables
Partial Least-Squares Regression (PLSR) Equations
R
2
RMSE (dS·m
-1
)
M-
A
SAVI
y
=5.75+10.66
x
1
+76.31(
x
1
)
2
0.25
**
1.83
M-
B
SAVI
Band-6
y
=5.64-58.77
x
1
+27.24
x
2
-
87.86(
x
2
)
2
+70(
x
1
)
2
+159.72(
x
2
)(
x
1
)
0.62
**
1.37
M-
C
SAVI
Band-6
Band-7
y
=0.11-22.03
x
1
+28.49
x
2
+33.12
x
3
-50.73(
x
3
)
2
-
54.84(
x
2
)
2
-43.70(
x
1
)
2
-37.83(
x
3
)(
x
2
)-
48.26(
x
3
)(
x
1
)+99.70(
x
2
)(
x
1
)
0.64
**
1.67
M-
D
SAVI
Band-6
Band-7
Band-8
y
=-5.07-4.70
x
1
+26.74
x
2
+33.22
x
2
+29.01
x
4
-26.94(
x
4
)
2
-
34.64(
x
3
)
2
-37.45(
x
2
)
2
-29.84(
x
1
)
2
-30.39(
x
4
)(
x
3
)-
20.89(
x
4
)(
x
2
)-29.64(
x
4
)(
x
1
)-25.84(
x
3
)(
x
2
)-
32.96(
x
3
)·(
x
1
)+68.08(
x
2
)(
x
1
)
0.67
**
1.19
Note:
y
is
ECa
;
x
1
,
x
2
,
x
3
and
x
4
are SAVI (
L
= 100), Band-6, Band-7 and Band-8 of WorldView-2 image respectively;
R
2
is determination coefficient. Significant: *
P
<0.05; **
P
<0.01; ns = not.
48
January 2018
PHOTOGRAMMETRIC ENGINEERING & REMOTE SENSING


