For our investigations, we implemented the processing
pipeline with the Python programming language and we used
the photogrammetric software package SURE (Rothermel
et al
., 2012) with its integrated
tSGM
dense image match-
ing algorithm for the computation of disparity maps.
However, alternative approaches for obtaining geospatial 3D
images can be considered, e.g., by meshing a lidar point cloud
and by re-projecting the depth information into image space.
Schneider
et al
. (2016) introduced a smart approach to obtain
point clouds directly from stereo fisheye images using the
epipolar equidistant projection model. In order to increase the
accuracy in the future, we will consider a pre-computed 3D
reconstruction employing multiple image sequences with the
advantage of an improved and even more accurate mesh in 3D
space (Cavegn and Haala, 2016).
Performance Analysis
In the following sections, we present empirical accuracy
analyses based on measured 3D points and 3D distances as
well as a qualitative assessment of a reconstructed 3D city
model based on imagery captured by our
MMS
configuration.
Study Area
Our study area is located at a very busy junction between
five roads in the city center of Basel, Switzerland. It includes
three tramway stops resulting in many overhead wires and is
surrounded by rather tall commercial properties that cre-
ate a very challenging environment for
GNSS
positioning.
Furthermore, a large number of moving objects in the form
of pedestrians, cars, and tramways were present since we ac-
quired the mobile mapping data on a weekday in August 2015
shortly before noon (Cavegn
et al
., 2016). However, the high
acquisition rate leading to along-track distances between suc-
cessive image exposures of approx. 1 m facilitated mitigating
the negative effects caused by these moving objects. Whereas
ground control points (
GCP
) for image-based georeferencing
were captured in March 2015, checkpoint coordinates for the
evaluation of both relative and absolute accuracy were deter-
mined using a total station in July 2017.
Accuracy Analyses
Empirical accuracy investigations constitute a crucial part of
our performance analysis since they will give an indication of
the achievable accuracy for most of the practical use cases in
urban road environments. Blaser
et al
. (2017) performed accu-
racy analyses using manual (monoscopic) point measurements
in both stereo images. In contrast to Blaser
et al
. (2017), we in-
vestigate the accuracy in this contribution by 3D mono-plotting
in 3D geospatial images. In our use case, a 3D geospatial image
consists of the left image of the corrected equidistant stereo
image pair with RGB channels and an additional disparity
channel with perspective disparities as previously described.
Our investigations will represent the overall system accuracy,
which is equivalent to the accuracy of a cloud-based 3D web
service. In terms of accuracy, the absolute and relative accura-
cy need to be considered separately. Whereas the relative accu-
racy influences the estimation of distance measures, absolute
orientation errors affect the accuracy of point coordinates.
Test Fields
We performed our empirical accuracy investigations in three
different test fields consisting of natural target points, which
we had estimated with sub-centimeter accuracy by a total
station. This allows dividing and analyzing different error
sources separately. Residuals (e.g., from image measurement)
are transmitted as a rising function of the distance. However, in
equidistant images an additional rising error transmission func-
tion of the image radius occurs. Schneider
et al
. (2016) provide
investigations on this error transmission in equidistant images.
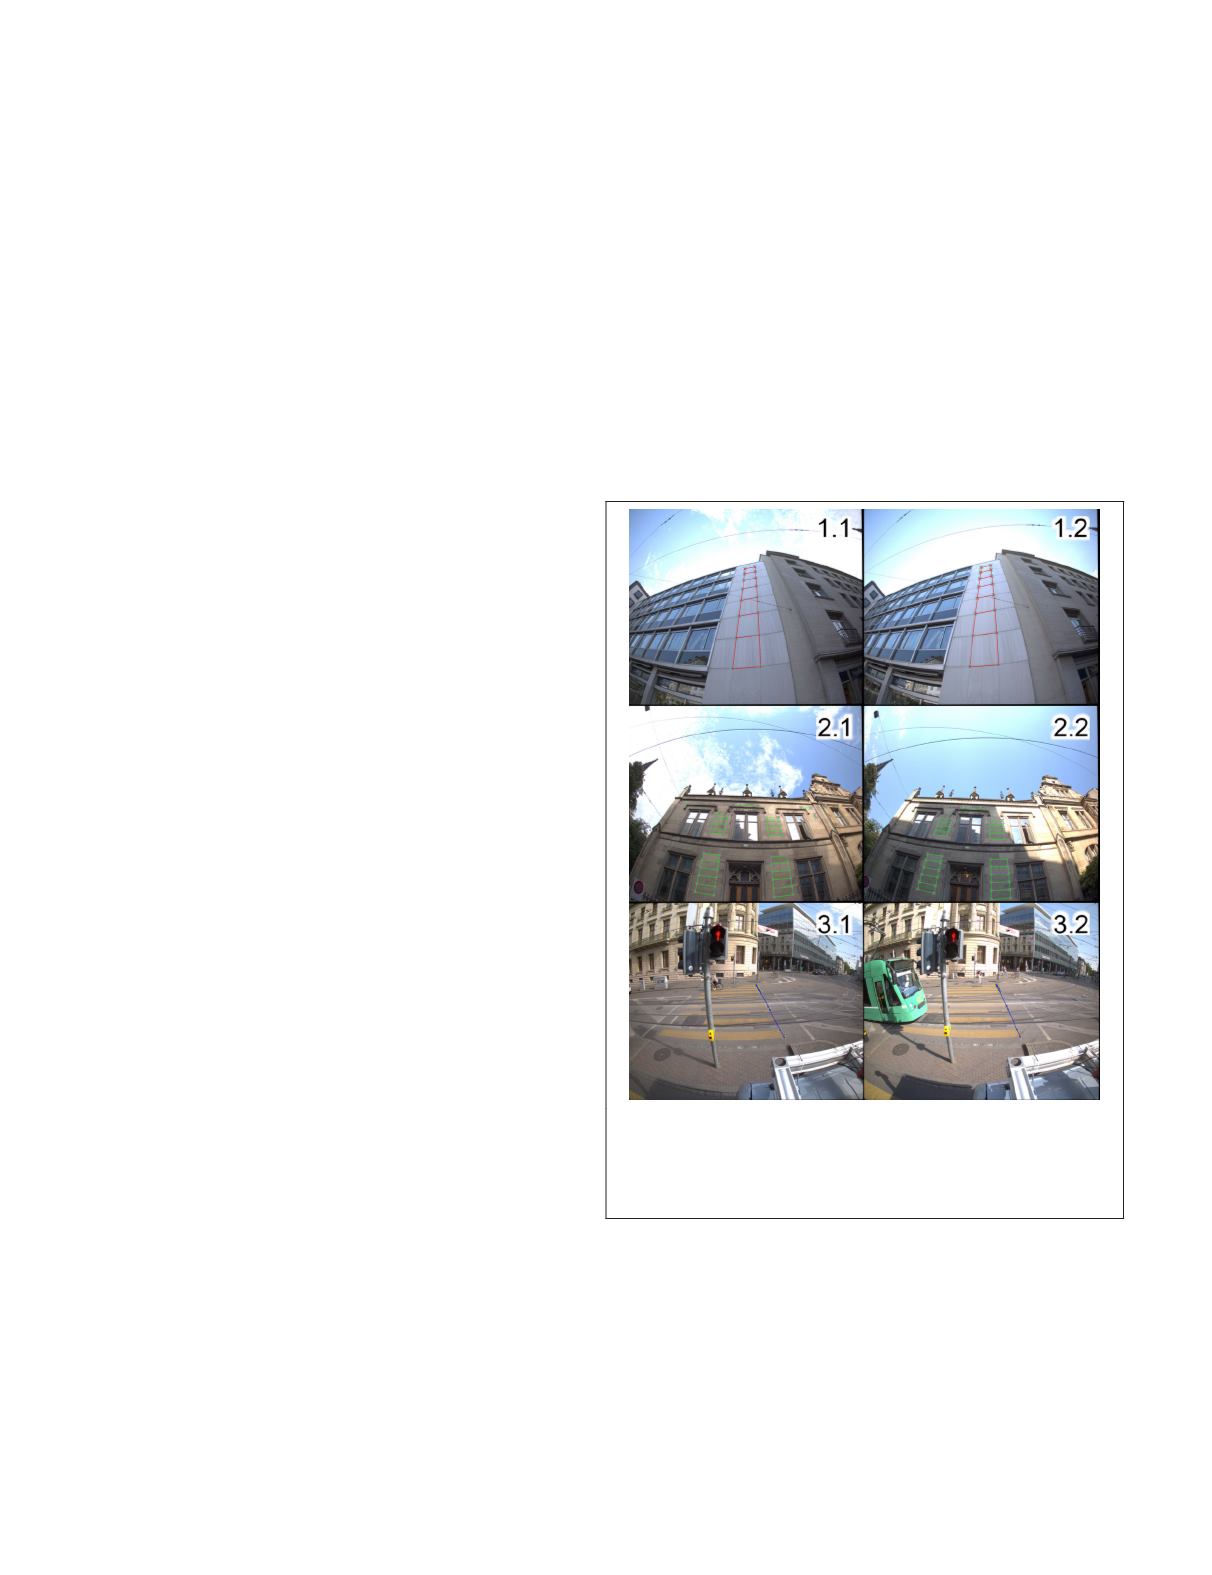
Our first test site contains 16 reference points on a façade
in an object distance range from 4 m to 14 m (see Figure 11,
top row) which is suitable for investigations of the distance-
dependent error influence. The second test field contains
55 reference points on a façade (see Figure 11, middle row).
Thanks to the evenly distributed reference points between
the image center and the corresponding edges, as well as due
to the smaller object distance range from 5 m to 9 m, this test
field is suitable for analyzing the effect of radial-dependent
errors. The third test field contains 12 reference points
(see Figure 11, bottom row), and it is equally useful for the
analysis of the distance-dependent error influence, but covers
the use case of road infrastructure management. We evalu-
ated two different 3D images per test site (see Figure 11) as
well as eight independent image measurements per point in
order to ensure statistical independence and repeatability. We
captured the first as well as the second test site (façade) with
stereo system No. 4 (II.4 & III.4) and the third test site (pedes-
trian crossing) with stereo system No. 2 (II.2 & III.2).
Figure 11. Test sites (top row: façade with a long distance
range, middle row: façade with a short distance range,
bottom row: pedestrian crossing with a long distance
range, left column: first thoroughfare, right column: second
thoroughfare).
Evaluation of Relative Accuracy
We determined relative accuracy by comparing photogram-
metrically measured 3D distances with their reference 3D dis-
tance. By the formation of 3D distances, exterior orientation
uncertainties of the navigation system are eliminated. There-
fore, only uncertainties of the
IO
and
RO
calibration, image and
reference measurements affect 3D distances. In our investiga-
tions, we regarded the reference distances as error-free. First,
we evaluated the accuracy and precision of measured 3D dis-
tances in dependence of object distance (see Figure 12). In the
first test site (1.1 & 1.2) as well as in the second test site (2.1
& 2.2), we observed a small distance-dependent decrease of
352
June 2018
PHOTOGRAMMETRIC ENGINEERING & REMOTE SENSING


