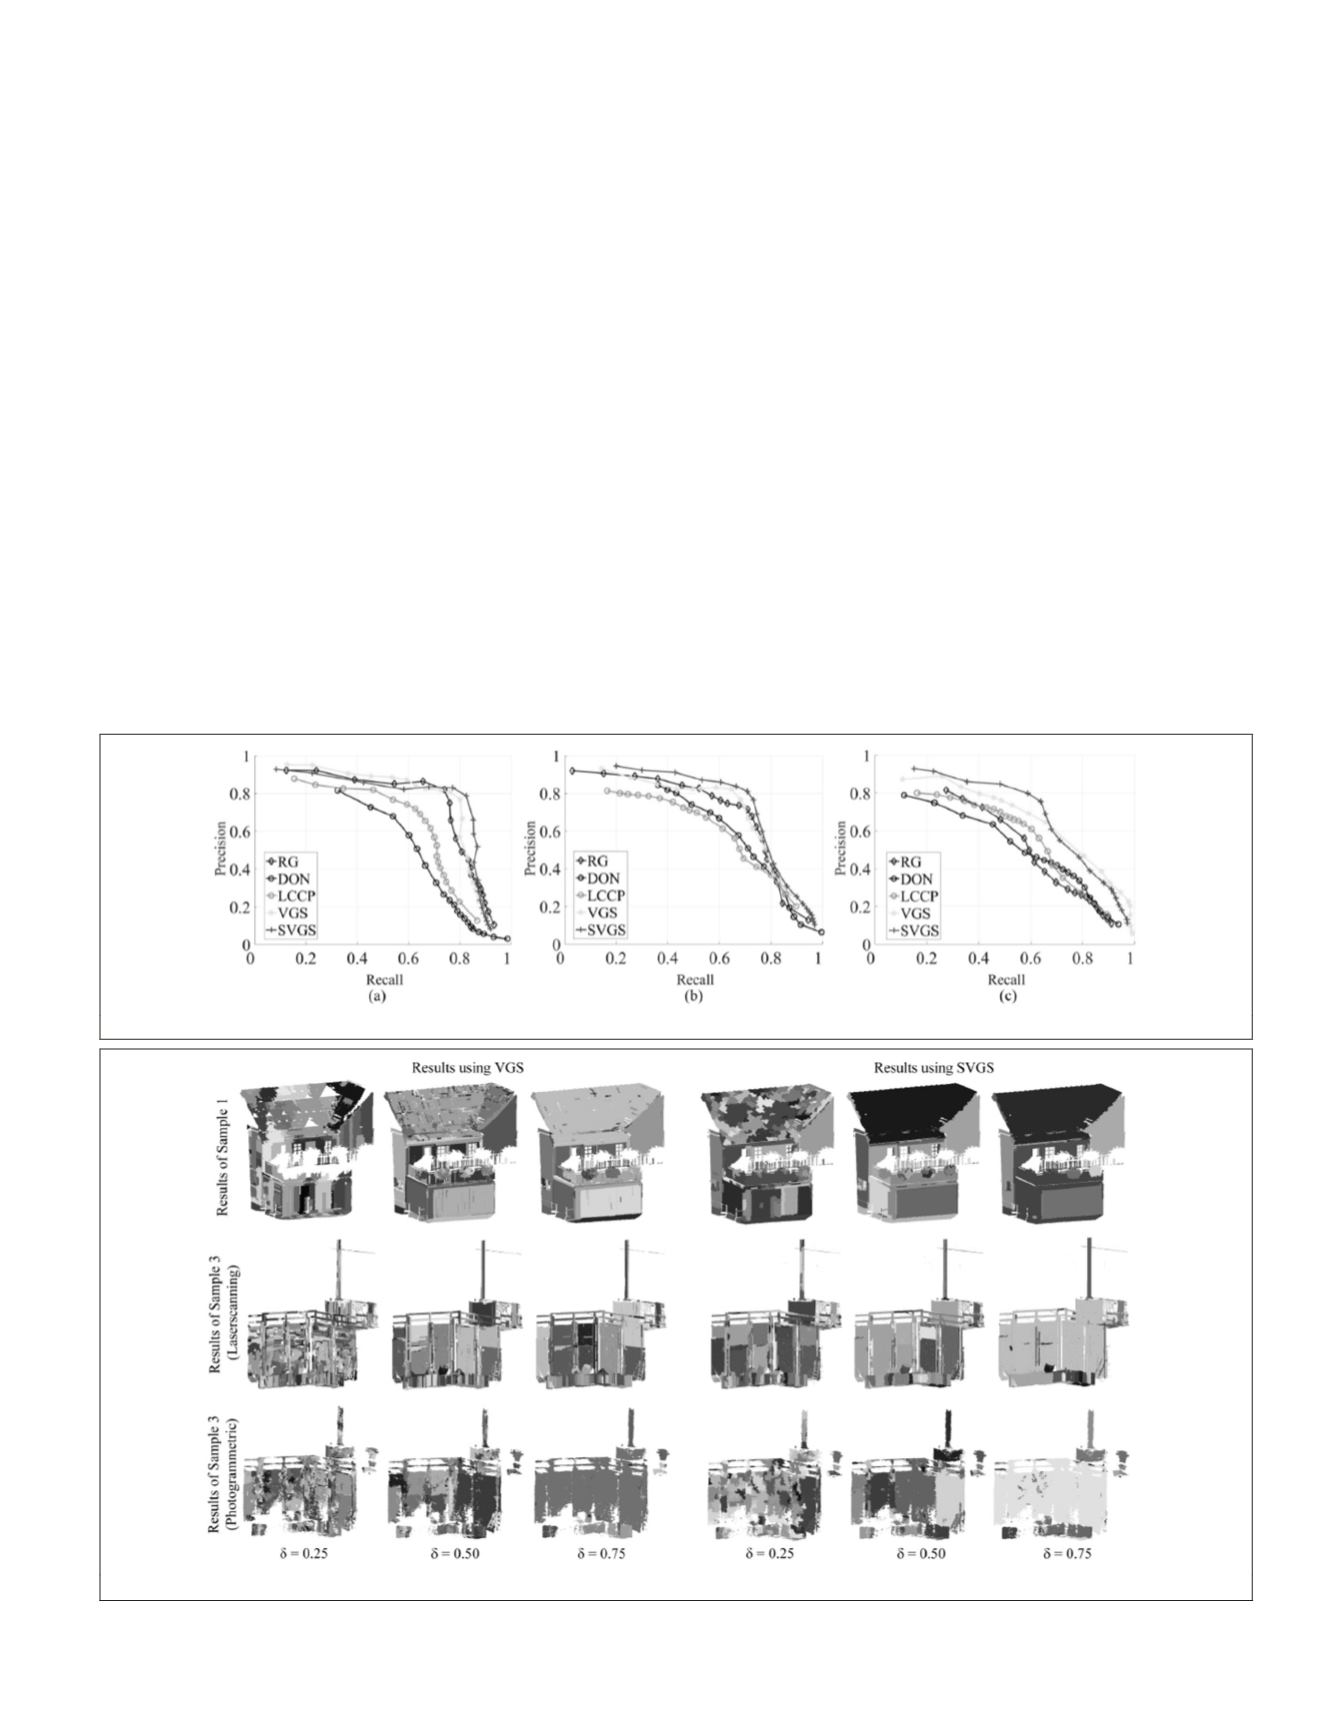
changing thresholds and parameters of the segmentation
methods. Here, the voxel resolutions used in
LCCP
,
VGS
, and
SVGS
are fixed to 0.1 m, equaling to the radius of normal
vector estimation in
RG
and small radius of normal vector
estimation in
DON
. Seed resolutions of supervoxels in
LCCP
,
VGS
, and
SVGS
as well as the large radius of normal vector
estimation in
DON
are all set to 0.25 m. The parameters that
are changed control the granularity of the final segmenta-
tion results, having an impact on whether the algorithm will
deliver an over-segmentation or an under-segmentation. For
RG
and
DON
methods, the changed threshold is the angle dif-
ference of normal vectors, ranging from 5° to 90°, while for
the proposed
VGS
and
SVGS
methods, the changed parameter
is the threshold δ for graph segmentation, ranging from 0.1 to
1.0. For
LCCP
, the changing values are the convexity tolerance
and smoothness, both of them ranging from 0.1 to 5.0. The
tested 466 datasets are Sample 1 (see Figure 6a) and Sample 3
(see Figure 6b); in the latter case involving laser scanning and
photogrammetric point clouds.
As shown in the
PR
curves of Figure 10, the proposed
methods have better performance than the baseline methods
for all the three testing datasets when the recall value is larger
than 0.75. Besides, the shapes of these
PR
curves also indicate
that the proposed methods can obtain better segments with
a good tradeoff between precision and recall. Specifically,
for both laser scanning datasets, the classical
RG
method can
obtain approximate or even better precision values than those
of
VGS
and
SVGS
with small recall values. This phenomenon
indicates that the
RG
method tends to create over-segmented
results for the test datasets. Such a phenomenon can also be
observed in the result of the
LCCP
method. This is because the
smoothness and convexity criteria used in
LCCP
can segment
planar surfaces and box shape objects well, but when dealing
with complex surfaces or structures, for example, objects of
linear shape or rough surfaces with patterns, they are likely
to generate over-segmented fragments, breaking the entire
structure into small facets. In contrast, as for the result using
our photogrammetric dataset, the inferior geometric accuracy
of our photogrammetric points degrades the segmentation
performance of all the methods, especially for point-based
methods (i.e.,
RG
and
DON
), with their precision and recall val-
ues lower than 0.6 at best. This may be explained by the fact
that the stereo matching errors in our dataset, which may re-
sult from our image configuration and distances from objects,
influence the reliability of estimated normal vectors of points.
In other words, these normal vectors are wrongly estimated,
leading to blurred details of objects and in consequence to
wrong segmentation results.
For the proposed methods, as expected, the threshold of
graph segmentation plays a crucial role and is responsible
for the over-segmentation or under-segmentation of obtained
results. To give a more detailed view, we illustrate segmenta-
tion results of using
VGS
and
SVGS
with three varying thresh-
olds of graph segmentation in Figure 11. As seen from this
figure, it seems that too large threshold will cause will cause
under-segmentation while too small thresholds will lead
Figure 10.
PR
curves of (a) Sample 1, (b) Sample 3 (Laser scanning), and (c) Sample 3 (Photogrammetric).
Figure 11. Segmentation results of using
VGS
and
SVGS
with different thresholds of graph segmentation.
PHOTOGRAMMETRIC ENGINEERING & REMOTE SENSING
June 2018
387


