to over-segmentation. Such results suggest that the use of
inappropriate thresholds will result in a wrong partition of
the local contextual graph, so that connections of voxels are
wrongly estimated. Besides, comparing results of these two
methods, it can be observed that the
VGS
method is more sen-
sitive to the change of thresholds. To be specific, for the
VGS
method, it is obvious that the smaller the threshold, the finer
the granularity of obtained segments, whereas for the
SVGS
method, the point cloud has already been segmented properly
with a small threshold. Then, with the increasing thresh-
olds, the quality of the segmentation results does not change
significantly. Furthermore, another interesting finding is that
despite using the same threshold and parameters, segmenta-
tion results of different data types (i.e., laser scanning or pho-
togrammetric points) are totally different. Specifically, laser
scanning datasets are more sensitive to changes of thresholds
than photogrammetric ones. This phenomenon can be easily
observed by comparing shapes of
PR
curves from Figures 10b
and 10c; namely we can hardly find obvious turning points of
these
PR
curves for all the tested methods.
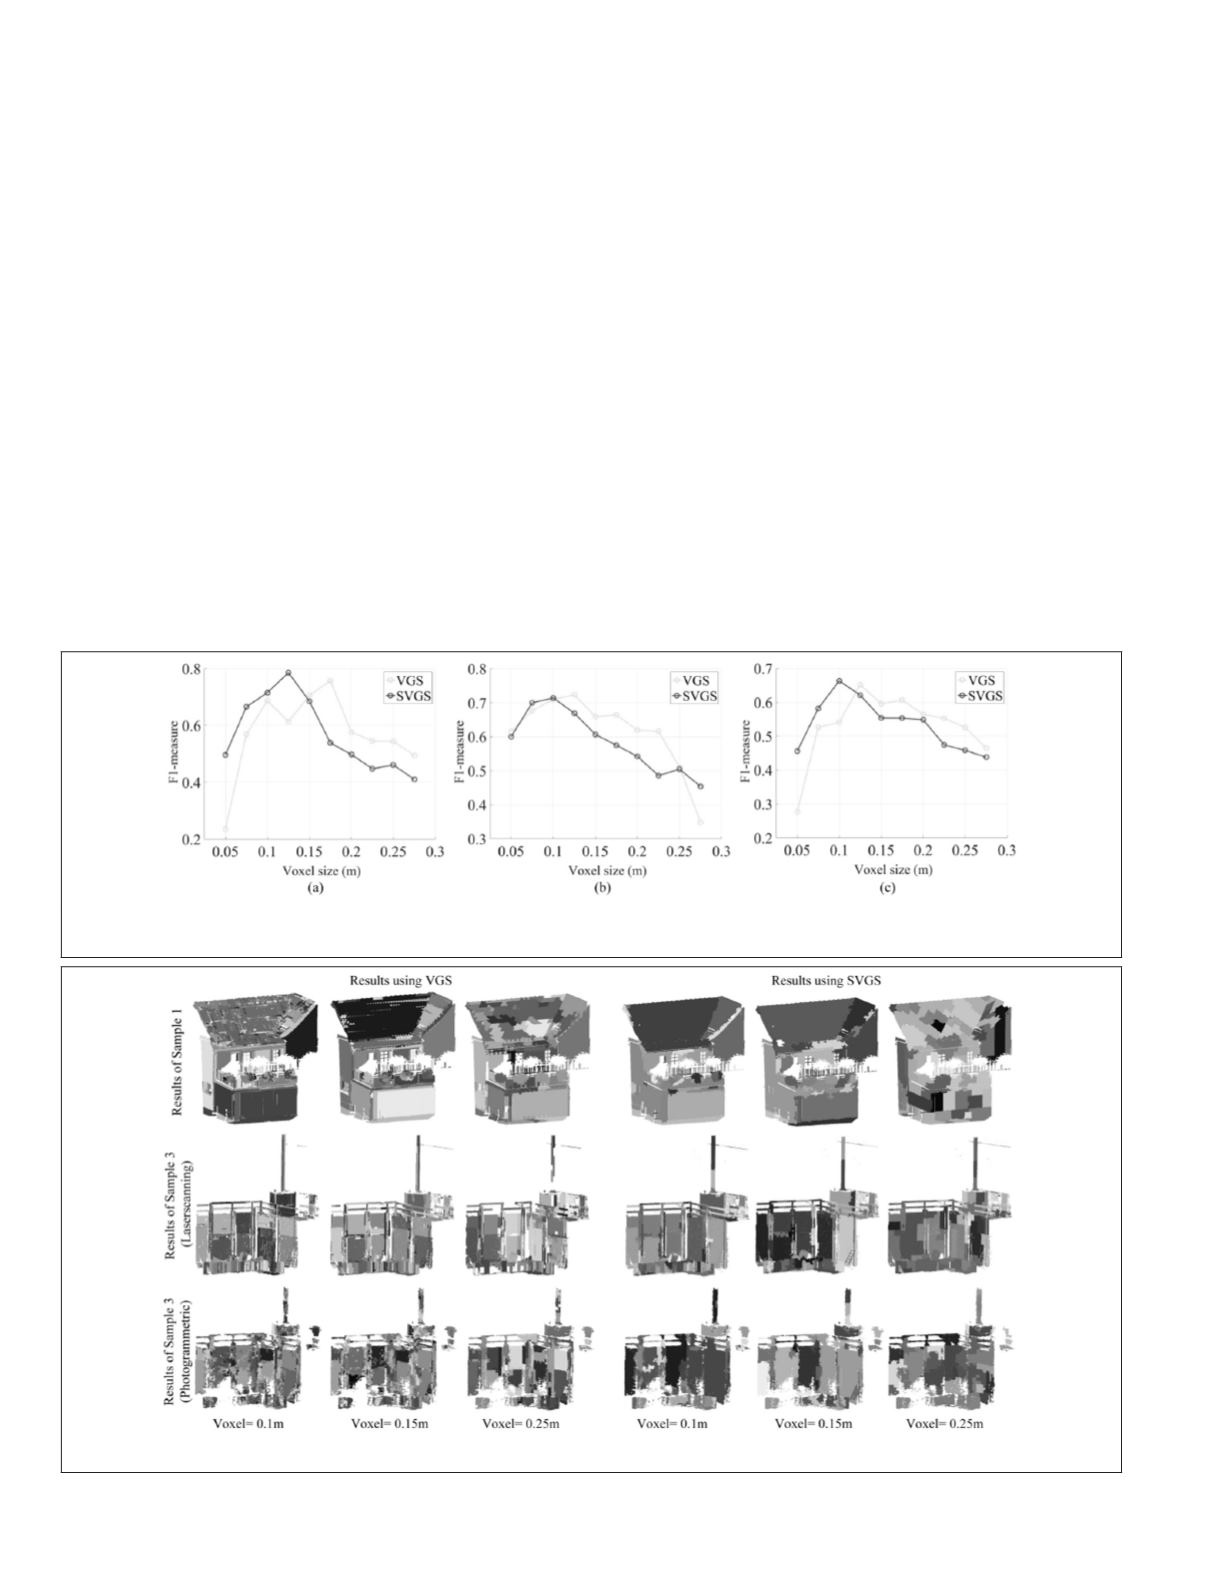
Granularity of Voxelization
As mentioned earlier, the granularity of the voxel structure
is also an essential factor influencing the quality of obtained
segments using the proposed methods. For analyzing the un-
derlying relation between the granularity of voxelization and
the accuracy of segments, we conduct experiments by using
different sizes of voxels and supervoxels, with certain thresh-
olds
δ
for graph segmentation. Here, for a given threshold
δ
of graph segmentation, voxel resolution used in both
VGS
and
SVGS
ranges from 0.05 m to 0.25 m, with an incremental inter-
val of 0.025 m. The seed resolution of supervoxels in
SVGS
is
set to three times the voxel resolution used. In these tests, the
threshold
δ
of graph segmentation is set to 0.5. The testing da-
tasets are Sample 1 (see Figure 6a) and Sample 3 (see Figure
6b), involving both laser scanning and photogrammetric point
clouds. In Figure 12, the F1-measures of the segmentation
results are displayed.
In Figure 12, it can be seen that only with an appropriate
resolution of voxels, the proposed methods can achieve opti-
mal segmentation results. These optimal results correspond
to the maxima of these curves. For results of
VGS
, the highest
F1-measures of these three datasets are around 0.8, 0.70, and
0.66, respectively, whereas for the
SVGS
method, the highest
F1-measures of these three datasets are around 0.75, 0.71, and
0.65, respectively. It is an interesting finding that compared to
SVGS
, the
VGS
method requires a relatively smaller voxel reso-
lution for the same dataset under the same threshold of graph
segmentation. For providing a more direct view, in Figure 13,
we illustrate segmentation results of using
VGS
and
SVGS
meth-
ods with different voxel granularities. Based on the figure,
we can deduce that both too large or too small sizes of voxels
will result in over-segmentations of the entire scene. However,
Figure 12. F1 -measures of (a) Sample 1, (b) Sample 3 (Laser scanning), and (c) Sample 3 (Photogrammetric), using different
voxel granularities.
Figure 13. Segmentation results of using VGS and SVGS with different voxel granularities.
388
June 2018
PHOTOGRAMMETRIC ENGINEERING & REMOTE SENSING


