bands tend to be negative, while
those with the NIR band are apt
to be positive. However, once the
window exceed 33, the correlation
coefficients given by the visible
bands exhibit the greatest increase
to become positive and remain
high across the remaining windows
except at the 47 window and again
the 61 window where the lowest
value is given. On the other hand,
after the 31 window, the correlation
coefficients provided by the NIR
band drop a lot to report negative
values for the remaining windows.
The lowest point is immediately
noted at the 33 window, followed
by the 49 and 61 windows.
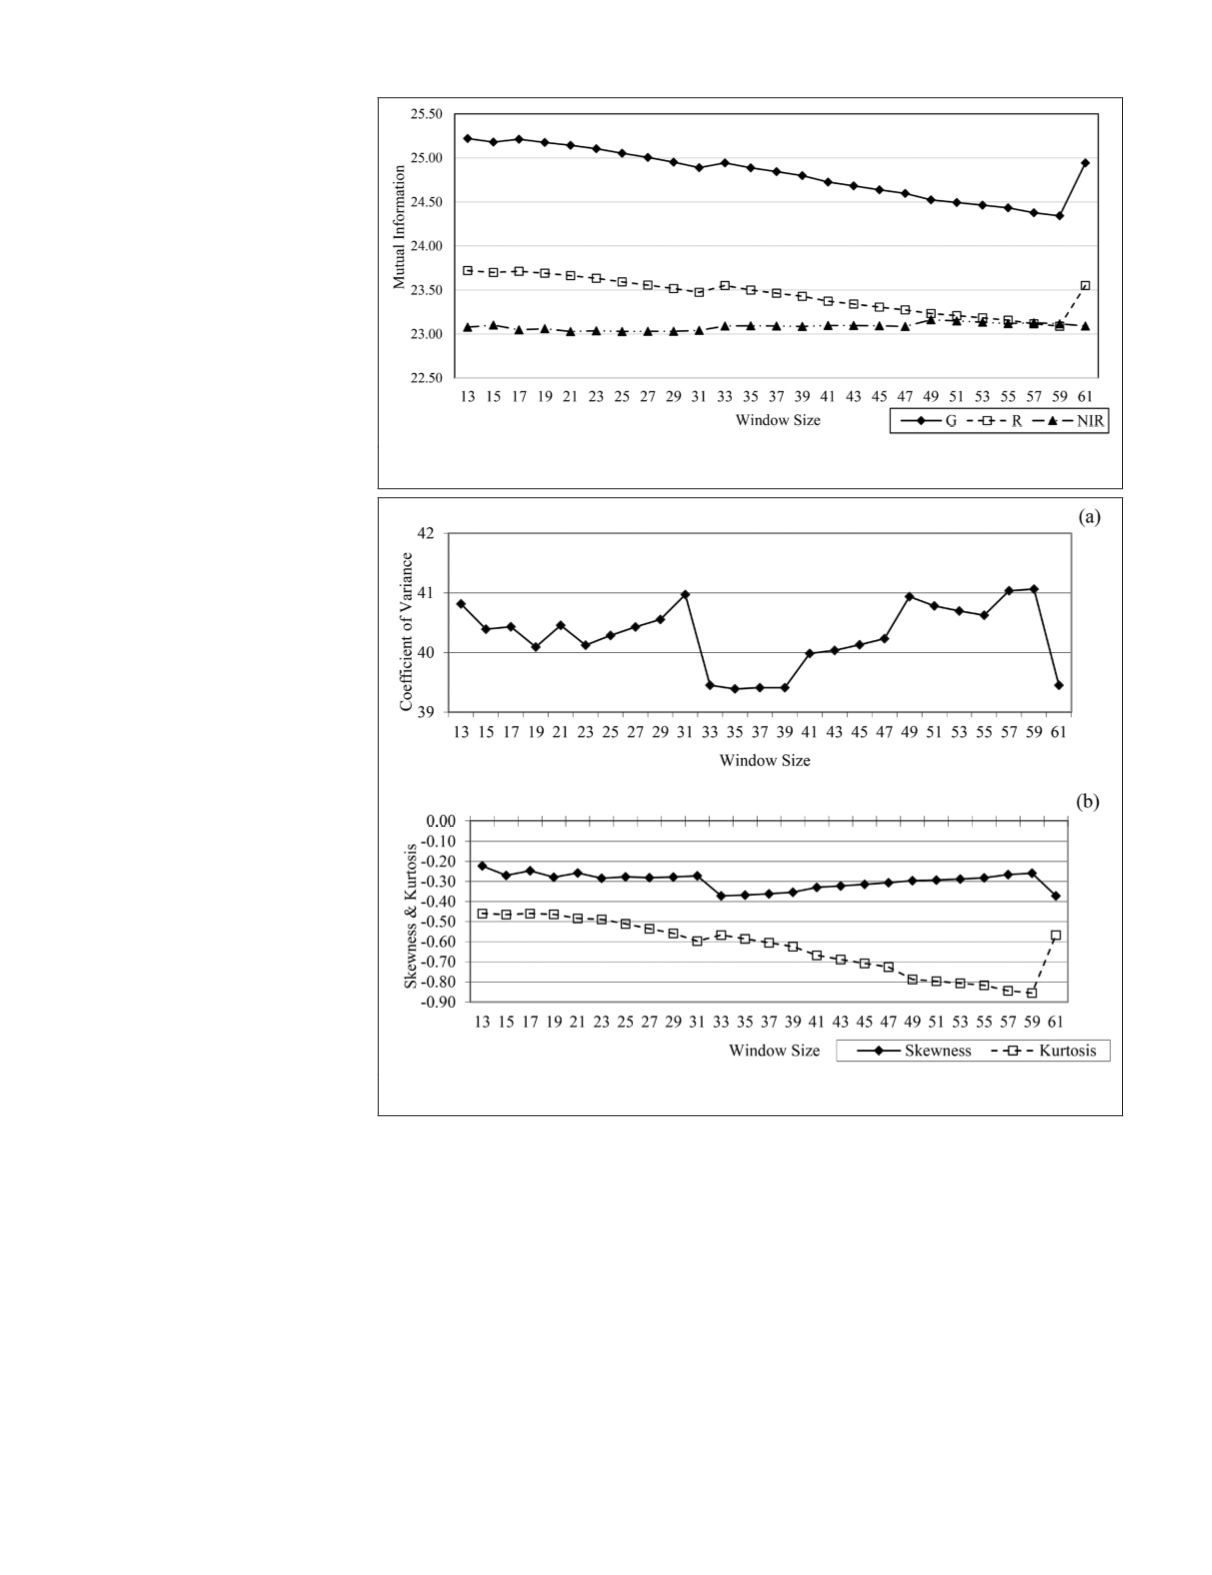
From Figure 4, it is clear that
the MIs reported by the G band are
the highest, followed by the R and
NIR band, respectively, across all
windows, indicating the G band
is more dependent on the texture
features than the R and NIR bands.
With the three reflective bands,
the MI analysis behave quite the
same on the G and R bands that
both illustrate a gradually decreas-
ing trend with increasing window
sizes (range = 0.88 for the G band
and range = 0.63 for the R band).
It thus suggests the two bands
become more independent on
texture features extracted by larger
window sizes. The exceptions are
at the 31 – 33 windows where a
slight increase is noticed and again
the 59 – 61 windows where a great
increase is observed. As for the
NIR band, however, its MIs are the
lowest and change little across all
windows (range = 0.13), indicating
its independence on various texture
features does not change much due
to varying window sizes used in
feature extraction. When comparing
the results of Pearson correlation
and MI analysis, two different con-
tributions seem to be possible with
texture features created before and
after the 33 window when the
ML
image classification is considered. On one hand, the smaller
correlation coefficients from the left side of the 33 window
imply that texture features extracted from windows smaller
than 33 could supplement more dissimilar information to the
three spectral bands that are also used in the classification. On
the other hand, the smaller MI values from most of the right
side of the 33 window suggest that texture features extracted
from windows larger than 33 could also be valuable since they
tend to be more independent on the three reflective bands.
However, since the calculated MIs do not fluctuate much
across all window sizes for individual R, G, and NIR bands,
it is believed the independence of all image bands of interest
should only have a very limited impact on the selection of a
subset of texture features based on different window sizes for
the
ML
classifier applied later in this study.
Texture Bands Evaluation by Coefficient of Variance, Skewness, and
Kurtosis Statistics
With increasing windows, the
CV
graph changes significantly,
clearly demonstrating the influence of using different win-
dow sizes on feature extraction (Figure 5 a). The two largest
changes are found at the 31 – 33 and 59 – 61 windows where
the
CV
reduce sharply, followed by the biggest increase at the
47 – 49 windows. Resultantly, three major depressions could
be identified from this graph at windows of 13 – 31, 31 – 49,
and 49 – 59, with the second one varied the most, followed by
the first and the third ones. Obviously, the lowest
CV
values
all present right after the 31 window, ranging from 33 – 39.
Another window associated with comparably low
CV
is 61.
From Figure 5b, it is observed the resultant skewness values
are all higher than the kurtosis ones with the former reporting
a smaller range than the latter. Before the 31 window, both
statistics reduce gradually with the former change more than
the latter. Yet after this window, the skewness values increase
Figure 4. Mutual information between fractal-based texture bands and three reflective
bands of the
ETM+
image (red, green, and near infrared).
Figure 5. Coefficient of variance (
CV
) (a) and
SK
ewness (
SK
) and
KU
rtosis (
KU
) and (b) by
the fractal-based texture bands.
700
November 2018
PHOTOGRAMMETRIC ENGINEERING & REMOTE SENSING


