JM
distance ranges from 0 to 2, with 0 indicating a com-
plete overlap between the signatures of two classes and 2
indicating a complete separation between the two classes.
Both measurements are related to classification accuracies.
Overall, higher separability values lead to better final classi-
fication results. The analysis of
JM
distance was based on the
following rules set in this study: <1.70 for a poor separability;
1.7 – 1.9 for an acceptable separability; 1.90 – 2.00 for a good
separability; and 2.00 for an excellent separability.
Once all classified images from either textural or spec-
tral classification were available, accuracy assessment was
perform based on a total of fifty test zones randomly picked
for each
LULC
categories from the same reference data (the
aerial photo and zoning
GIS
layer) used to select training sites
earlier. Common statistics for image classification evaluation
such as overall accuracy, producer’s accuracy, user’s accuracy,
and Kappa coefficient (or Khat) were produced.
Image Classification Results Comparison
To fully evaluate the efficiency of textural classification by
incoporating the fractal information as compared to those
spectral classification without the fractal information, each
classificaiton was compared and examined by using the
JM
distance computed between different
LULC
categories and the
variables extracted from accuracy assessment, such as overall
accuracy, producer’s accuracy, user’s accuracy, and Khat.
Furthermore, the pairwise statistical Z test of Khat was also
utilized since it can identify whether the two error matrices
are significantly different (Cohen, 1960). The test is performed
using the formula given by Congalton
et al.
(1983):
Z
=
−
+
∧ ∧
∧ ∧
K K
1
2
1
2
2
2
σ σ
(6)
where
K
∧
1
and
K
∧
2
are the kappa coefficient of classification 1
and 2; and
σ
∧
1
2
and
σ
∧
2
2
are the asymptotic variances of
K
∧
1
and
K
∧
2
, respectively. In this study, the Z statistic was computed
using the ArcView
®
3.x Kappa analysis extension designed by
Jenness and Wynne (2006). Using the normal distribution at
the 95.00% confidence level, the classification is significantly
different from another if the absolute Z value exceeds 1.960.
Results
Texture Bands Evaluation by Correlation Analysis and Mutual Information
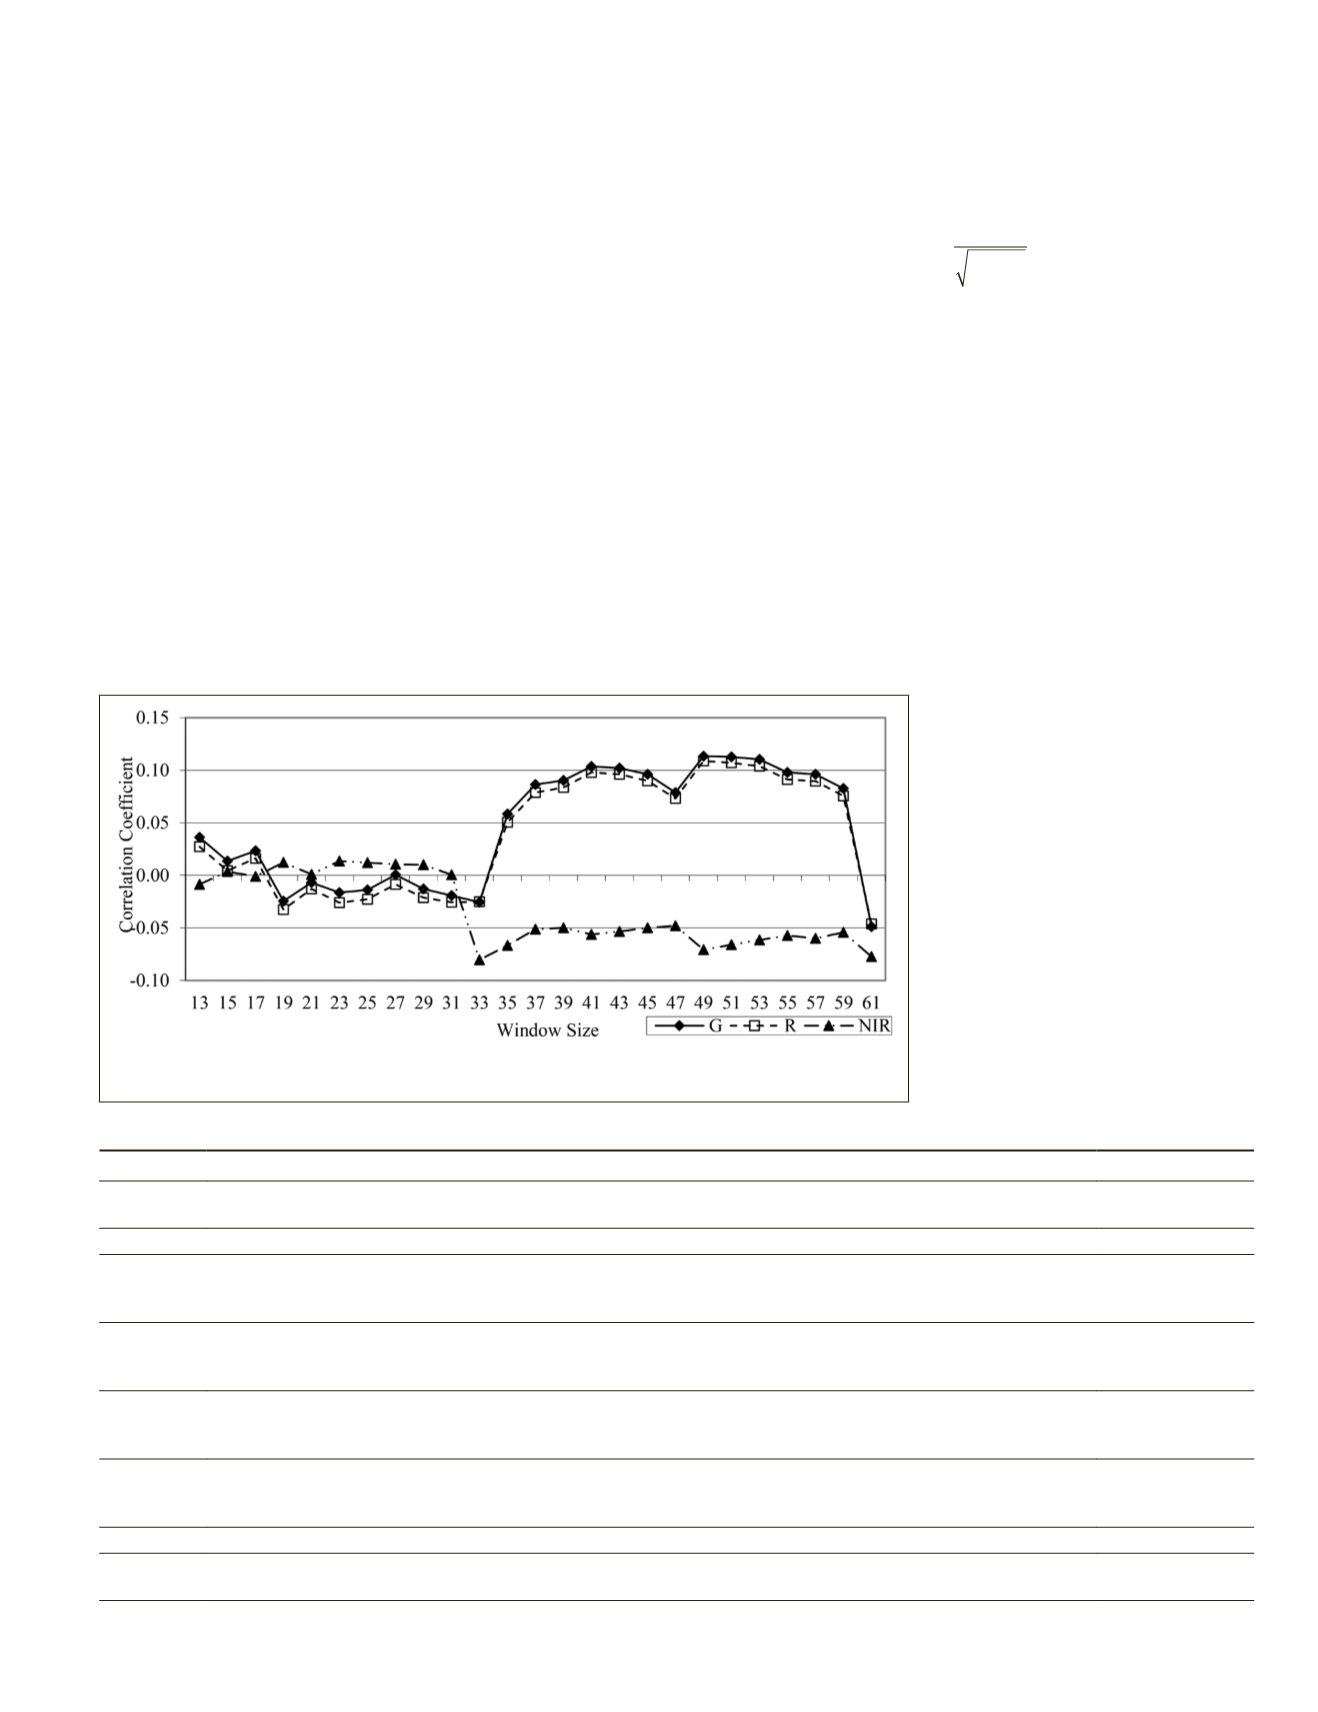
Figure 3 shows the results of correlation analysis between
fractal-based texture bands and three reflective bands of the
ETM+
image. Probably because the texture bands were extract-
ed from the R band, they tend to be closely and consistently
correlated with the visible G and R bands but to maintain an
inverse relation with those related
to the NIR band across all window
sizes. As windows scaled up, major
transitions are found at the 31/33
– 33/35, 47 to 49, and 59 – 61.
Obviously, all three bands’ correla-
tion coefficients fluctuate a lot and
remain to be low (less than |0.04|)
up to the 33 (for R and G bands) or
31 windows (for NIR band). This
suggests the fractal-based textural
images generated with smaller
windows might hold more poten-
tial than those with larger windows
in offering additional “unrelated”
information than those from the
visible and NIR bands; thus could
contributing to image classification
when all bands are used. Besides,
the correlations with the G and R
Table 1. Description of eight land use and land cover classes derived by supervised image classification
Classes
Basic Description
# of Training Sites
Cropland
and pasture
Areas covered by herbaceous vegetation planted for the production of food, feed, or fruit including row corps
(e.g., corn and soybeans), small grains (e.g., wheat), pasture/hay, fallow, and orchards.
12
Water
All areas persistently covered by open water including streams, lakes/ponds, and reservoirs.
9
Commercial
and
industrial
Areas characterized by a high percentage of constructed materials (e.g., asphalt, concrete, buildings, etc.)
including airports, central business district, commercial districts, hospital complexes, industrial uses, roads and
highway, universities, and all related facilities and accessory uses. Barren land is also included in this class.
15
High
density
residential
Areas with a typical density of 12 – 140 units per acre and minimum open space of 0.27 – 2.65 % including
medium intensity multifamily, urban multi-use residential, suburban high-rise apartment, and central and
inner-city high rise apartment.
12
Medium
density
residential
Areas with a typical density of 2 – 9 units per acre and a minimum open space of 65% - 75% including
suburban single-family, low or medium intensity single-family, medium intensity two-family, low intensity
multifamily
12
Low density
residential
Areas with a typical density of less than 2 units per acre and a minimum open space of 75% and more
including low density two-family, suburban single-family, mobile dwellings, agriculture and single-family,
and planned unit development.
10
Forest
Areas covered by woody vegetation including deciduous, evergreen, and mixed forest.
22
Grass
Areas predominantly covered by herbaceous and other understory systems including grasses, grasslike
plants, forbs, or shrubs (evergreen or deciduous) presented in open land and water.
12
Figure 3. Pearson correlation coefficients between fractal-based texture bands and three
reflective bands of
ETM+
image (green, red, and
NIR
).
PHOTOGRAMMETRIC ENGINEERING & REMOTE SENSING
November 2018
699


