slowly after a small drop but kurtosis reduces more following
a graduate increase. The two trends continue until at the last
tested window of 61 where the resultant skewness reduces
the same as at the 33 window, but the kurtosis augments a lot,
presenting the greatest change across all windows. For the
purpose of applying the supervised
ML
classifier, features with
lower
CVs
and small changes from skewness and kurtosis are
desirable. The observation of Figure 4 shows windows of 33
× 33 – 39 × 39 best qualify this requirement and should thus
be ideal to be used to generate texture bands most suitable for
performing supervised
ML
classification.
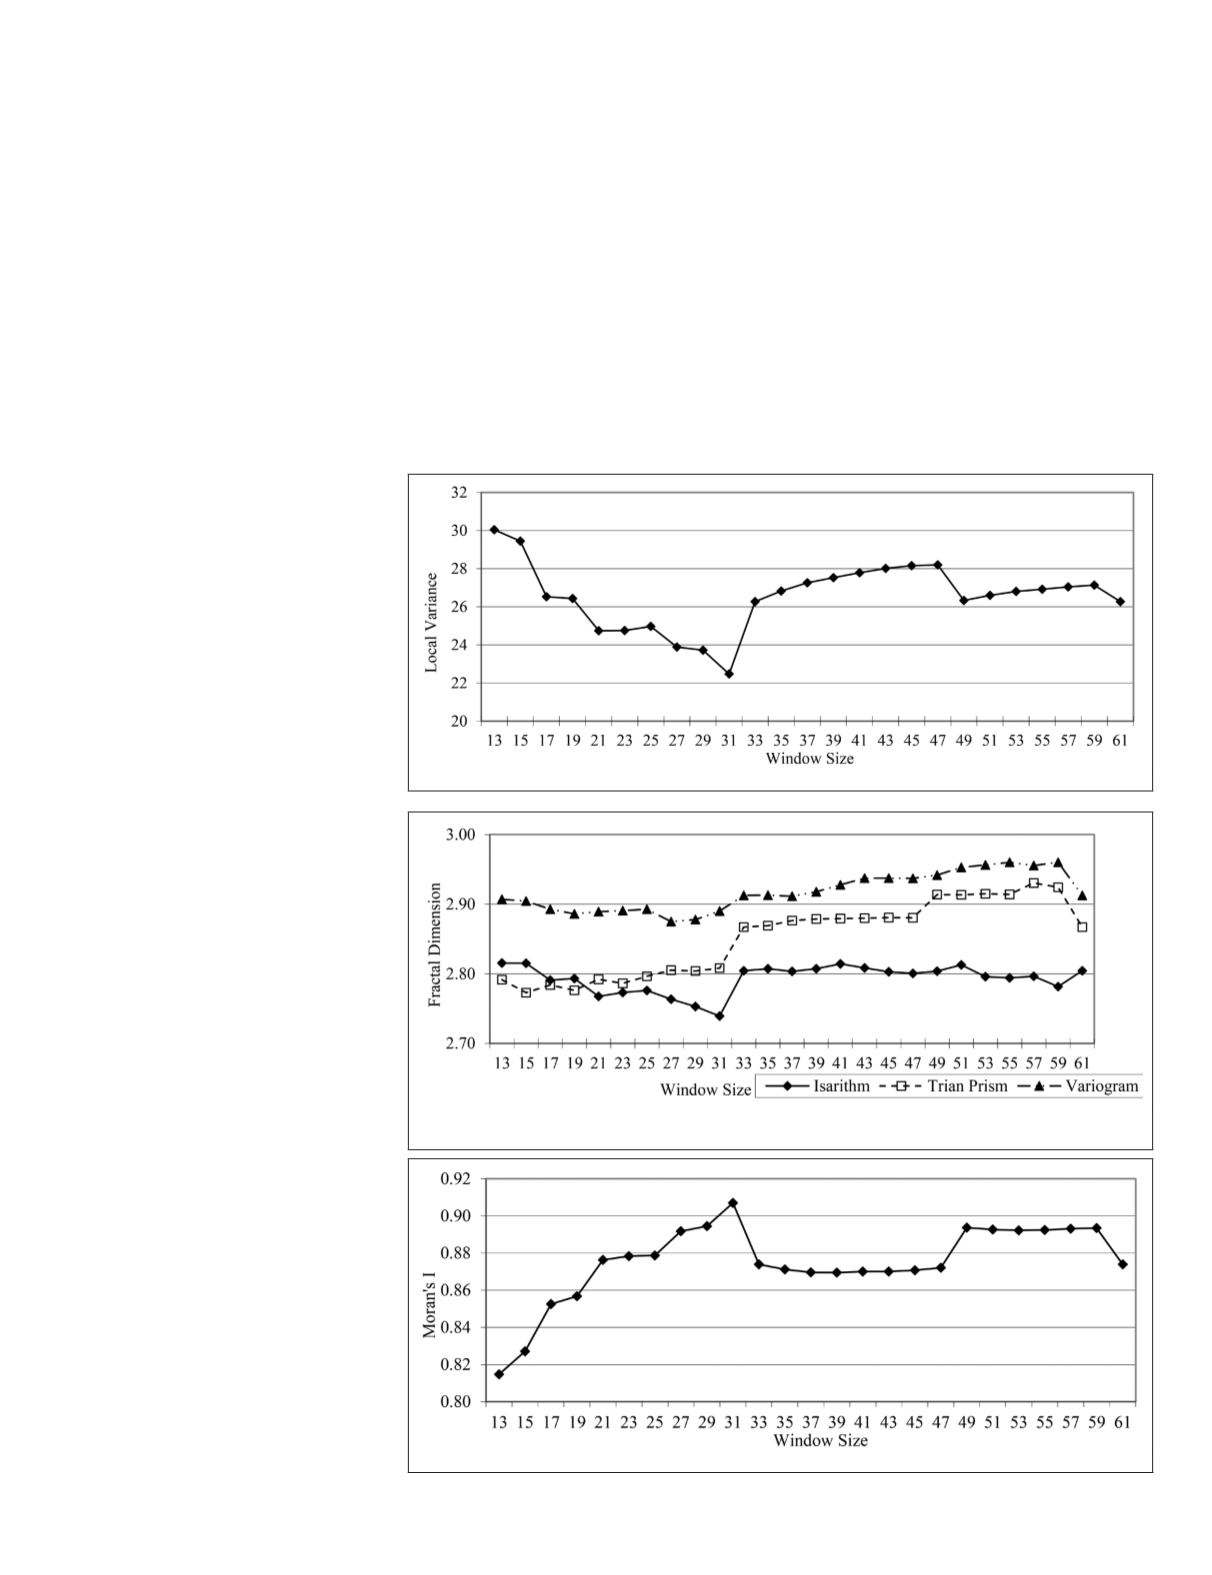
Texture Bands Evaluation by Local Variance
LV
values were computed for all texture bands using a 3 × 3
moving window and the results were plotted in Figure 6. The
idea of this part of analysis is to identify a chain of window siz-
es with similarly high
LVs
since these windows, though could
also correspond to noise, may help to best approximate the
spatial objects in the scene. Clearly,
with larger window sizes, the resul-
tant
LVs
reduce rapidly up to the 31
window. Beginning at this window,
the LVs increase greatly and then
maintain the trend of high values
up to the 47 window and again at
the 49 – 59 windows after a sudden
drop at the 49 window. Just as what
is observed from the correlation
analysis, coefficient of variance,
skewness, and kurtosis statistics,
the
LV
descends at the 59 window.
Overall, only high LVs correspond-
ing to the 33 – 47 windows seem
to stand out than others, suggesting
these might be the applicable win-
dow sizes that would help to match
the landscape objects recorded in
the imagery. The texture bands cre-
ated by these windows may thus be
more valuable than others to the
ML
image classification.
Texture Bands Evaluation by Fractal
Analysis and Moran’s I Index
Figure 7 illustrates the
FD
results
computed by three
FD
estimation
algorithms (isarithm, triangu-
lar prism, and variogram) for all
texture bands. The guideline of con-
ducting this part of analysis is to
locate window sizes with higher
FD
values, assuming these high values
indicate underlying key changes in
fractal texture images’ complexity.
For all texture bands, the
FDs
cal-
culated by the variogram algorithm
are the highest. With a few excep-
tions, the results derived by the
triangular prism method, the same
method used to generate all texture
bands, are surprisingly higher than
those from the isarithm method
(Figure 7). This is contradictory to
other fractal-based research using
the same methods since most, if
not all, of them demonstrated the
triangular prism method tended to
report smaller
FD
values than the
other two
FD
estimation approaches
(Lam
et al.
, 1997; Lam
et al.
, 1998; Lam
et al.
, 2002; Liang
et
al.
, 2013). It may suggest that the
FD
measurement could be im-
proved from images generated with the same
FD
algorithm as
both the image creation and
FD
calculation consider the fractal
nature from the same perspective. Generally speaking, the
FDs
calculated by the three methods tend to be consistent across
all windows and they all illustrate the most obvious transition
around the 31 – 33 windows. As windows sized up, the
FDs
decrease in general before the 31 window. After a major jump
at the 31 – 33 windows, the
FD
results become larger and larger
(from the variogram and triangular prism method) or gently
stable (from the isarithm approach). These trends continue
until reaching the 61 window, at which both the variogram
and triangular prism’s results reduce suddenly but those from
the isarithm method augment instead. Overall, larger
FD
values
are mostly found with windows of 33 – 57/59, suggesting these
larger moving windows are more likely than others to produce
texture bands with greater spatial information.
Figure 6. Local variance (
LV
) by the fractal-based texture bands.
Figure 7. Fractal dimensions by the fractal-based texture bands using isarithm,
triangular prism, and variogram methods.
Figure 8. Moran’s I index by the fractal-based texture bands.
PHOTOGRAMMETRIC ENGINEERING & REMOTE SENSING
November 2018
701


