measurements. To gain more detailed character of simulated
waveforms, we utilized high-precision airborne lidar point
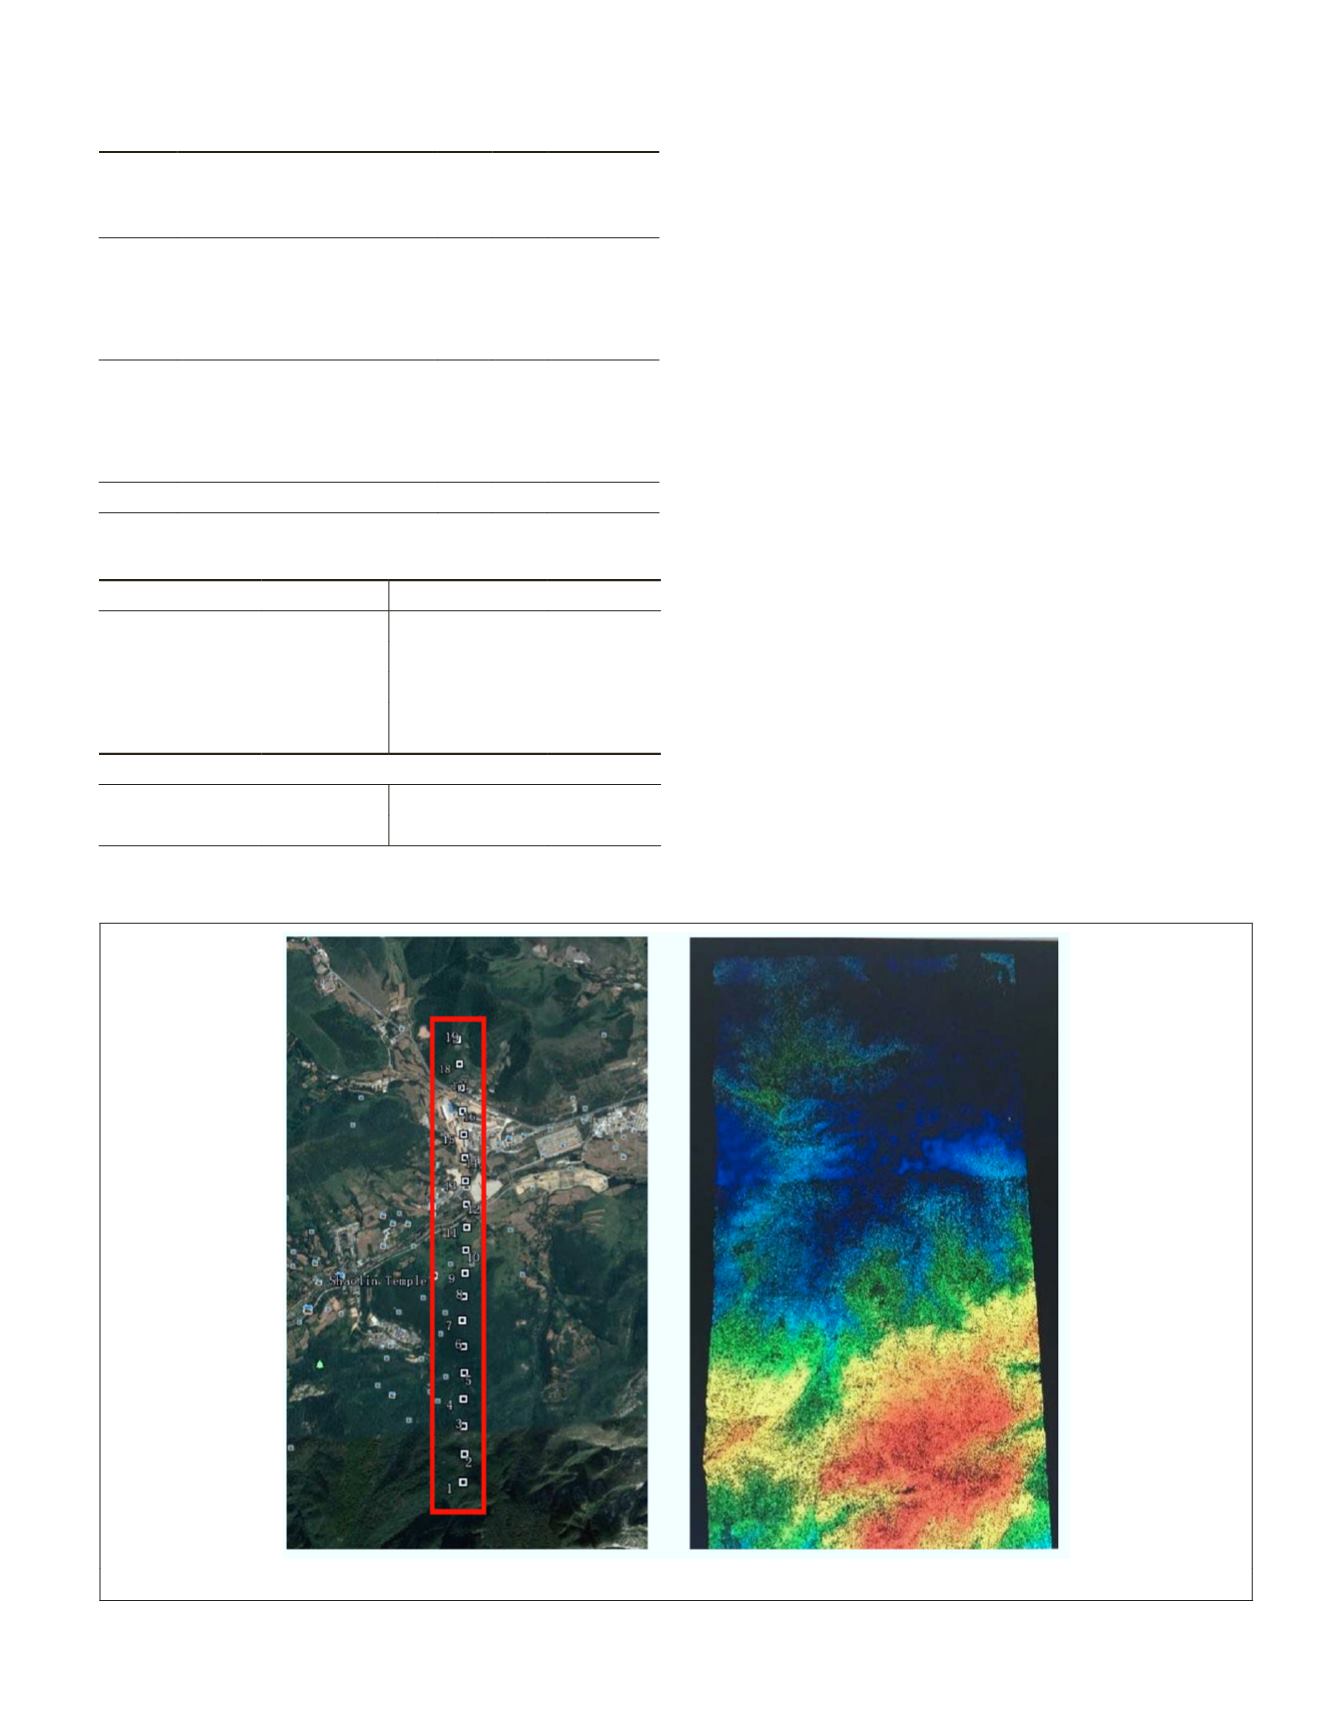
cloud located at Shaolin Temple of Henan province in China
with a spatial resolution of 2 m and accuracy of 0.15 m. There
are 20 measurements of the
GLAS
and corresponding lidar data
with a region of 3.3 × 6.8km
2
, and the test field and airborne
lidar data are shown in Figure 3.
The information of
GLAS
footprints and airborne lidar point
cloud are enumerated in Table 2. Within a
GLAS
footprint of
70 m, there are approximately 2,400 points obtained by the
ALS60
airborne lidar.
At the test field, the nominal value of one-way atmospheric
transmittance is assumed to be 0.5, and the attitude angles
and the laser pointing angle are respectively zero and 0.3
degree. The
GLAS
data in the paper is collected on 21 Decem-
ber, 2003, and we acquired the rotation matrix
R
t
through the
International Earth Rotation Service as:
R
t
=
0 88 0 47 0
0 47 0 88 0
0 0 1
.
.
.
.
.
Results and Discussion
Simulation Results and Analysis
Based on the above data set, we first simulate the effect of
surface slope and roughness on
LFG
error by using the math-
ematical models, the distributions of which are illustrated in
Figure 4.
In terms of Equations 13 and 14, the horizontal errors in
x-axis and y-axis components are irrespective of range error.
Meanwhile, only the range error will change with the vari-
ability of surface slope and roughness among all impact
factors on the footprint geolocation error. Consequently, the
horizontal errors in x-axis and y-axis components are ir-
relevant with the surface slope and roughness. According
Table 1. The surface slope and roughness for nine
representative terrains.
Relief
Landform
Surface
slope
Roughness
s
(°)
s
^
(°)
σ
h
(m)
Low
Glaciated continental shield 1.7 1.4
0.8
Shallowly incised drainages 2.7 2.6
1.9
Moderately incised drainages 3.3 3.0
3.1
Ice cap and outlet glaciers
4.1 4.4
1.0
Moderate
Normal-faulted rift graben 6.7 4.5
4.7
Volcanic complexes
6.5 5.5
5.8
Fold and thrust mountain belt 15.5 18.4
11.1
Deeply incised drainages
21.0 21.3
14.1
High Convergent mountain front
27.9 28.4
14.5
Table 2. Comparison of
GLAS
footprints and airborne lidar
point cloud in the test field.
Satellite laser altimeter
Airborne Lidar
Instrument
ICESat GLAS Instrument
Leica ALS60
Flight altitude
600 km Flight altitude 500m
Footprint diameter 70 m
Spot diameter
1m
Spatial resolution
along the track
175 m
Horizontal
resolution
2m×2m
Topographic information
Elevation range
540~870 m Roughness range 2~16m
Slope range
1~40°
Area of region 3.3×6.8km
2
Figure 3. The test field and referenced lidar data.
PHOTOGRAMMETRIC ENGINEERING & REMOTE SENSING
October 2018
651


