Of the four pairs captured by default, the light conditions
at the time of data acquisition determine the most suitable
pair of hemispherical photos for identification of trees in the
sampling plot. To identify the apparent trees (those viewed in
the hemispherical photos) and to estimate the stand variables,
an automatic process, fully described in Sánchez-González
et al.
(2016) is implemented in a Matlab® software package
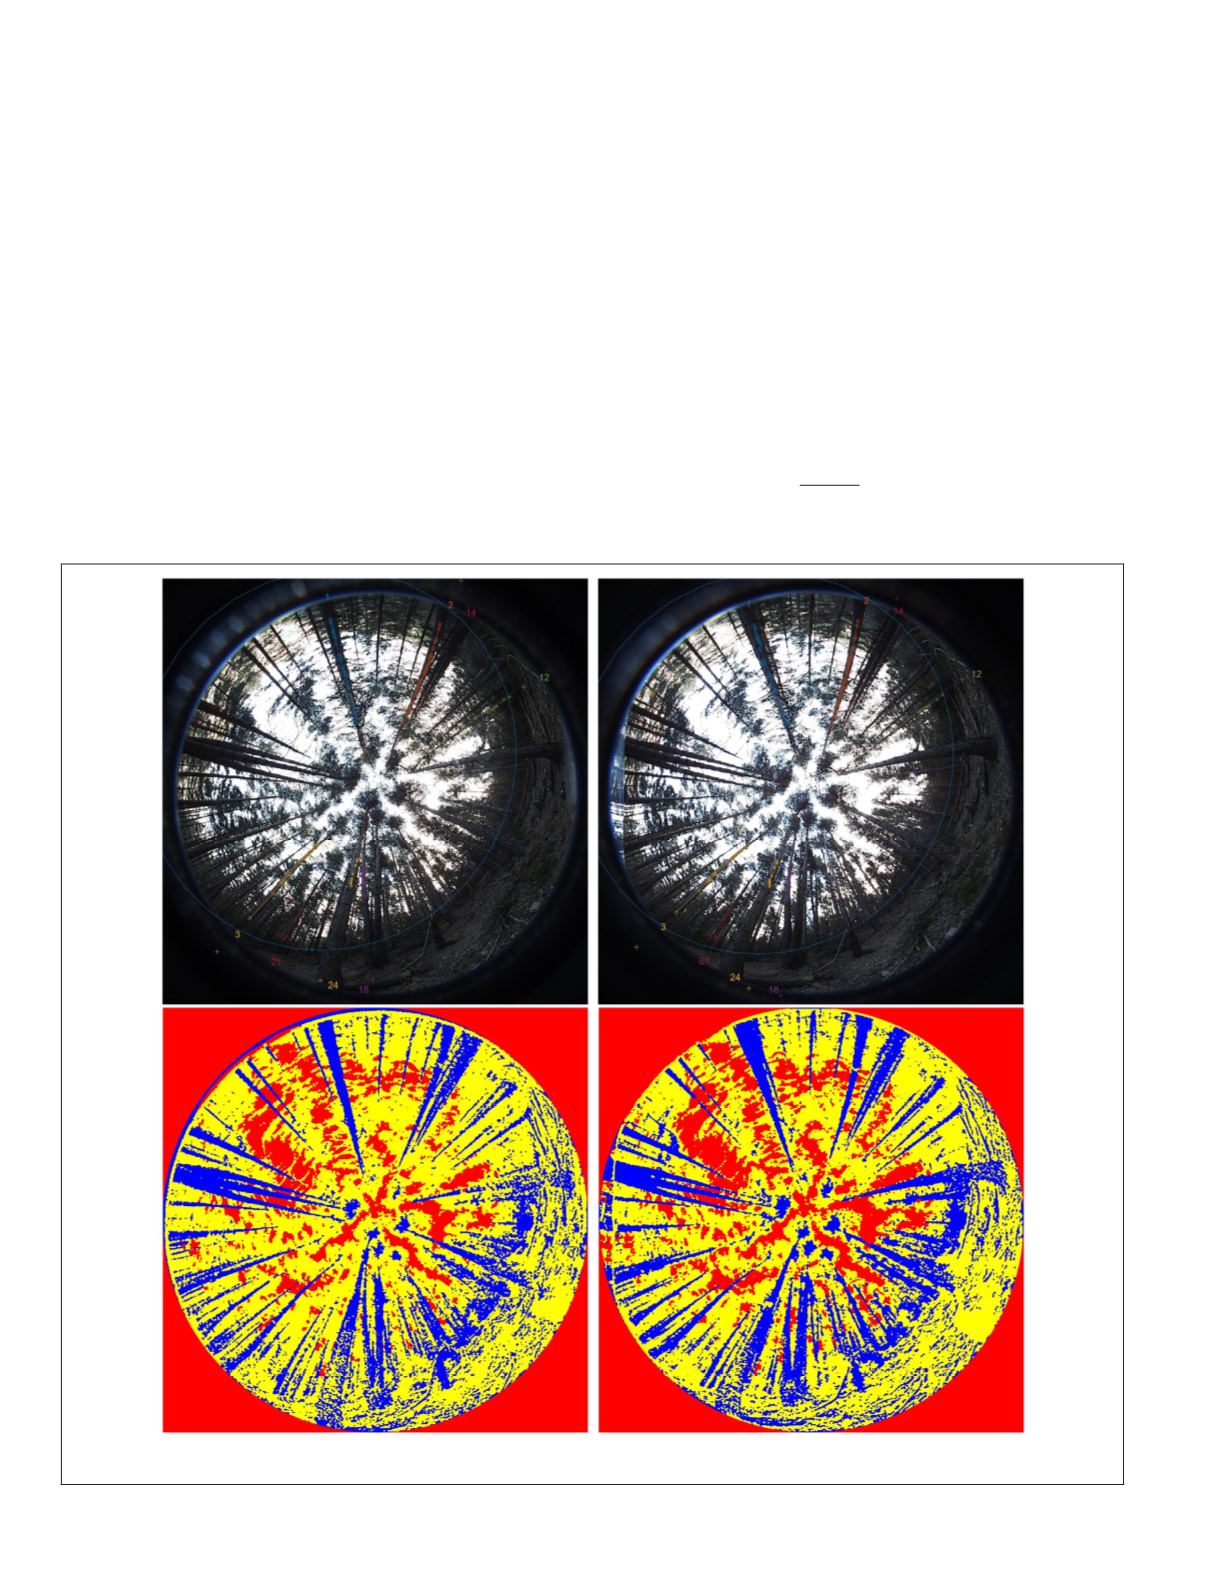
developed for the purpose. Basically, the image is segmented
into basic components: sky, tree stems, and foliage (Figure
3). During the image segmentation process tree stems are
identified in each image through a pixel-based dichotomous
hierarchical classification followed by a region-growing
process for individual tree labeling. The pixel-based classifi-
cation establishes four criteria:
intensity
to discriminate the
sky,
ratio
between green intensity, and the sum of red, green,
blue (RGB) intensities to separate the foliage from the stems,
and
local color variance
in the radial and tangential directions
to identify homogeneity of texture along the stem and stem
boundaries, respectively. The computation of these criteria re-
quires a minimum window size of 7 × 7 pixels, which in turn
determines the minimum size of projected stems identifiable
during segmentation. Cross-sectional slices are extracted from
the classified image, connected under geometrical constraints,
and labeled as individual stems in the region-growing process.
The correspondence process, that is, the matching of a
tree identified in both images of a pair, establishes the cor-
respondence between the homologous cross-sectional slices
of the segmented stem requiring identification of at least three
sections of the tree (Figure 3). The correspondence between
sections in both images is determined under restrictions of
epipolarity
(homologous points lie over the epipolar line in
the other image),
ordering
(height order of sections is main-
tained),
similarity
(diameter disparity is minimized), and
uniqueness
(points have a single match) (Herrera
et al.
2009).
A user-guided matching method was used for identification
of apparent trees missed by the automatic matching process
(Sánchez-González
et al.
2016).
The distance from the left camera (
d
1
) is calculated with
the equations developed by Rodríguez-García
et al.
(2014):
d d
sin
sin
cos
b
1
1
2
2
1
=
( )
( )
( )
−
( )
/
cos
α
α
α
α
(1)
Figure 3. Above: pair of stereoscopic hemispherical images. The colored point series indicate the matched sections; below:
classified image of the sky, foliage, and stems.
496
July 2019
PHOTOGRAMMETRIC ENGINEERING & REMOTE SENSING


