angle in the right image conditional on no occlusion in the
left image coincides with the intersection of the total shaded
angle and the range in the right image corresponding to being
visible in the left image:
ο
i
02
=
α
i
02max
– (
α
i
01max
+
δ
0max
)
(32)
Case 3. α
α
i
02min
<
α
i
01min
+
δ
0min
In this case the angle shaded by tree
i
in the right image lies
partially in the range of tree 0 projection in the right image
conditional on no occlusion in the left image. Also, the angu-
lar displacement of tree
i
(from left to right image) is smaller
than the angular displacement of tree 0. The occlusion angle
in the right image conditional on no occlusion in the left im-
age coincides with the intersection of the angle shaded and
the range in the right image corresponding to being visible in
the left image:
ο
i
02
=
α
i
01min
+
δ
0min
– α
α
i
02min
(33)
We calculated
α
i
02max
and
α
i
02min
for both
α
01
=
α
i
01max
and for
α
01
=
α
i
01min
, obtaining the maximum and minimum (not neces-
sarily in that order) values for
ο
i
02
. The final
ο
i
02
is the average
of
ο
i
02
calculated for
α
i
01max
and for
α
i
01min
.
Results
Number of Trees
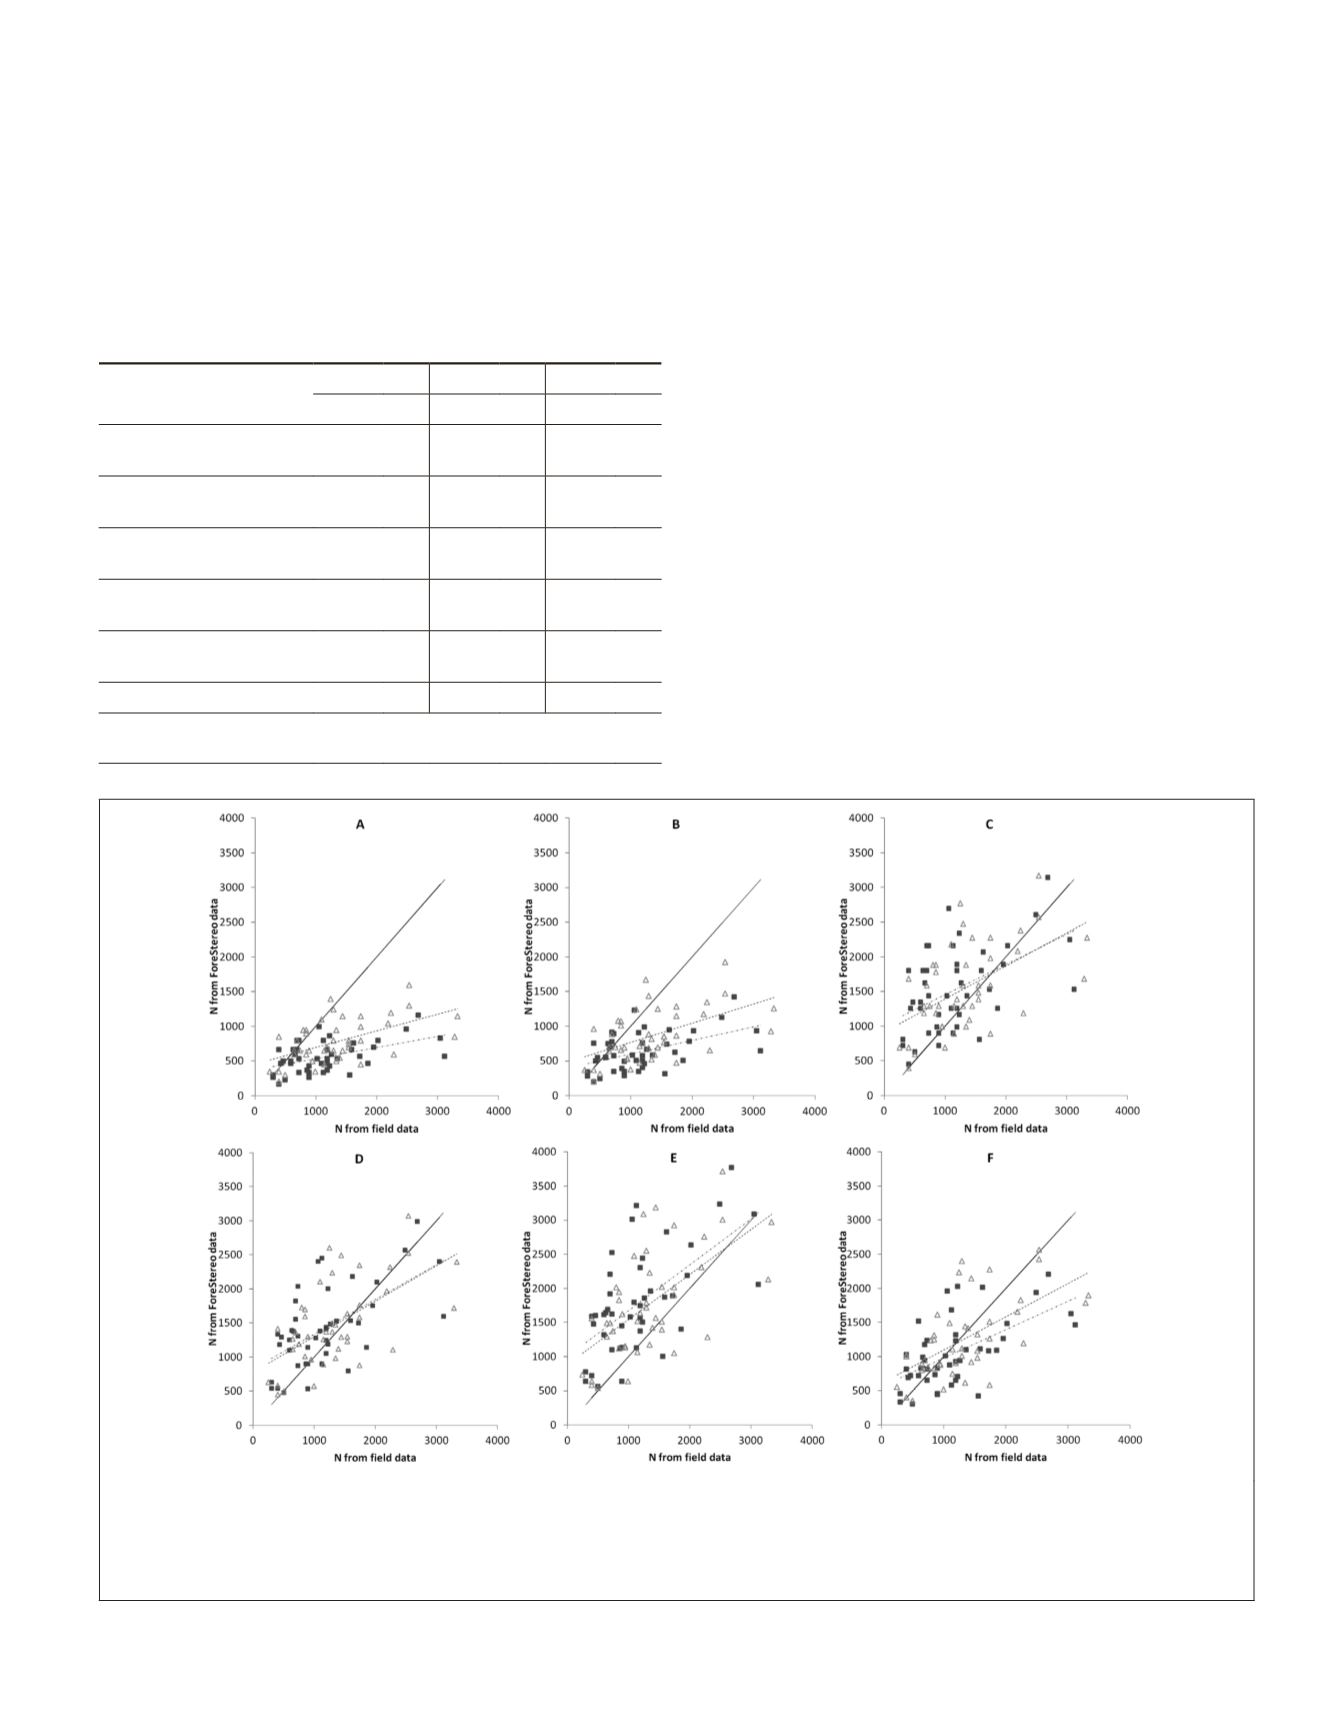
As expected,
N
was largely underestimated with the ForeSte-
reo sample of matched trees when not corrected for instru-
ment bias and occlusion effect; the bias increased with the
maximum sampling distance and the mean error ranged from
42% to 77% (Table 1). The underestimation of
N
was more
relevant in plots of higher density (Figure 7)—those occupied
by smaller trees. The Relaskop-based sampling with Poisson
Table 1. Bias (
ME
) and Pearson coefficient (r) of the
relationship between measured and estimated number of trees
per ha (
N
) in plots of 8 m, 9.8 m, and 15 m radius
R
.
R
= 8 m
R
= 9.8 m
R
= 15 m*
ME (%) r ME (%) r ME (%) r
ForeStereo sample
without correction
−42 0.54 −52 0.50 −77 0.40
Relaskop sampling +
Poisson attenuation model
−35 0.52 −46 0.49 −69 0.53
Distance-sampling
(Hazard-Rate)
16 0.54 31 0.50 26 0.40
Distance-sampling
(Hazard-Rate + covariate)
11 0.60 22 0.60
12
0.58
Distance-sampling
(Half-Normal + covariate)
33
0.62
53
0.62
49
0.59
HPC
−6
0.61
−10
0.59 −33 0.56
*ForeStereo estimates with 15 m maximum distance are compared
with the values calculated with the 9.8 m radius field plot.
Figure 7. Number of trees per ha (
N
) estimates from ForeStereo vs
N
estimated from field measurements and regression line
of linear models in plots of 8 m (empty triangles and dashed line) and 9.8 m radius (filled squares and dash-dot line). A:
uncorrected, B: Relaskop-based sampling and Poisson attenuation model, C: distance-sampling Hazard-Rate function, D:
distance sampling with Hazard-Rate function and
DBH
as covariate, E: distance sampling with Half-Normal function and
DBH
as covariate, F: hemispherical photogrammetric correction.
PHOTOGRAMMETRIC ENGINEERING & REMOTE SENSING
July 2019
501


