Performance
Following the previous research published in the literature,
we use one set for training the model and the other two sets
to test the proposed model. Thus, there are six training-testing
combinations in total. The testing data set consists of 100
000 patch pairs, in which 50% are positive pairs and the
other 50% are negative pairs (Balntas
et al.
2016). The stan-
dard evaluation protocol, the false-positive rate at 95% recall
(FPR95), is used to measure the performance of those methods.
Table 2 demonstrates the performance of the proposed
algorithm and other descriptors. All deep descriptors gener-
ally outperform the traditional
SIFT
algorithm. The proposed
descriptor in this article is a 128-dimensional vector, which
is the same as most other descriptors and achieves the best
performance among all descriptors.
Ablation Study
For better understanding the significance of the proposed
pyramid
CNN
and the loss function, we conduct experiments
on the Brown data set summarized in Table 3. In our experi-
ment, we train two separate models, one by replacing the
pyramid structure with a common
CNN
while keeping the pro-
posed loss function and the other by replacing the new loss
function with the margin ranking loss function while keeping
the proposed triplet network. In either case, we have observed
that the combination is better than using them separately.
Our experiments demonstrate that the pyramid structure,
which was used in the semantic labeling problem (Zhao
et
al.
2017), has been shown to be effective in the point match-
ing problem. Most researchers use the margin ranking loss to
optimize the model, and they manually set the value of the
margin threshold
by experience before they train the model.
This, however, can cause the triplet margin loss to have a con-
stant non-zero derivative w.r.t to the margin loss (Mishchuk
et
al.
2017). The loss function introduced in this article avoids
this drawback and selection of the
value manually and has
been demonstrated to be effective.
HPatches Data Set
Balntas
et al.
(2017) proposed a novel benchmark for evalu-
ating handcrafted and learned local descriptors. The new
benchmark is a patch-based data set that removes many of the
ambiguities. It contains 116 sequences of images, in which
57 scenes show great photometric changes (i.e., illumination
change) and 59 sequences show significant geometric de-
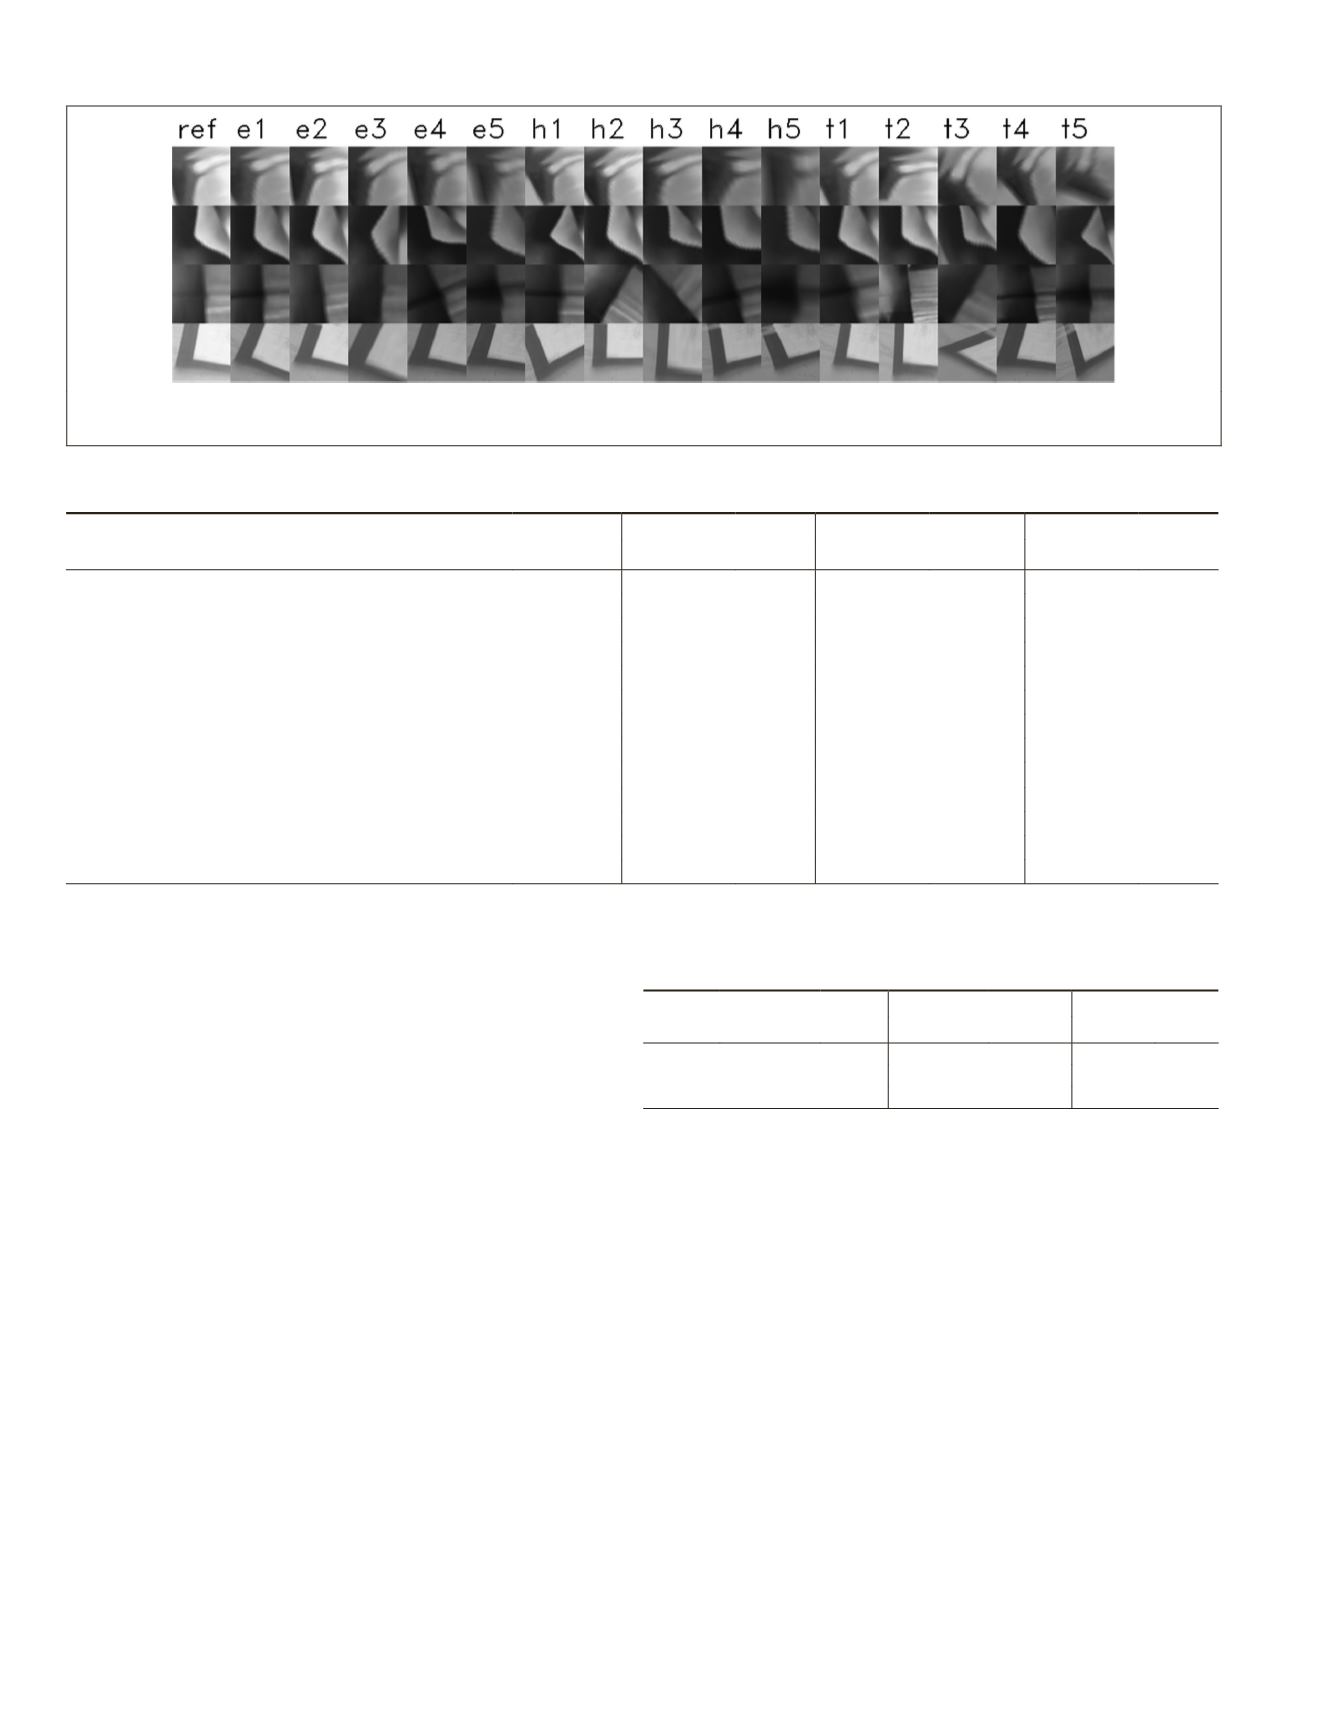
formations due to viewpoint change. A sequence includes a
reference image and five target images with varying geometric
changes. Several scale-invariant interest point detectors (i.e.,
difference of Gaussians, Hessian-Hessian, and Harris-Laplace)
are used to extract the patches in the reference image and
project on the target images using ground-truth homography.
By using a different transformation parameter, T, the patches
can be divided into three groups: Easy, Hard, and Tough. Fig-
ure 5 presents some image patches from the HPatches data set.
The HPatches data set is a multi-task benchmark that con-
tains three tasks—patch correspondence verification, image
matching, and small-scale patch retrieval—at the same time.
Figure 5. An example of the
reference
image patch,
Easy
,
Hard
, and
Tough
image patch in the HPatches data set (Zhao
et al.
2017): ref, e, h, and t represent reference,
Easy
,
Hard
, and
Tough
, respectively.
Table 2. Patch pair classification results from Brown data set. Numbers are the FPR95 for each algorithm. Bold numbers
indicate that the corresponding descriptors have the top performance.
Training
me Yosemite Yosemite Liberty
Test
iberty
Notredame
SIFT (Lowe 2004)
29.84
29.53
ImageNet
4conv
(Fischer
et al.
2014)
128
30.22
14.26
9.64
DeepCompare
siam
(Zagoruyko and Komodakis 2015)
256
15.89
19.91
13.24
17.25
8.38
6.01
DeepCompare
siam2stream
512
13.02
13.24
8.79
12.84
5.58
4.54
DeepDesc (Simo-Serra
et al.
2015)
128
16.19
8.82
4.54
MatchNet (Han
et al.
2015)
512
11
13.58
8.84
13.02
7.7
4.75
MatchNet
4096
8.39
10.88
6.90
10.77
5.76
3.87
TFeat
ratio
(Balntas
et al.
2016)
128
7.24
8.53
8.07
9.53
4.23
3.47
TFeat
margin
128
7.08
7.82
7.22
9.79
3.85
3.12
DeepCD (Yang
et al.
2017)
128
6.69
7.03
5.85
7.82
2.95
2.59
L2Net (Tian
et al.
2017)
128
1.71
2.57
2.36
4.70
1.29
0.72
HardNet (Mishchuk
et al.
2017)
128
1.84
1.96
1.49
2.51
0.78
0.53
Proposed
128
1.70
1.54
1.31
2.27
0.71
0.43
Table 3. Comparison of the three models: proposed pyramid
structure only, proposed loss only, and combined model on the
Brown data set. Bold numbers indicate that the corresponding
descriptors have the top performance.
Training Notredame Liberty Notredame Yosemite Yosemite Liberty
Test
Yosemite
Liberty
Notredame
Net
1.71
1.74
1.4
2.41 0.71 0.44
Loss
1.74
1.89
1.39
2.5
0.77 0.49
Proposed
1.7
1.54
1.31
2.27 0.71 0.43
678
September 2019
PHOTOGRAMMETRIC ENGINEERING & REMOTE SENSING


