Parameter Settings
For all experimental tests, the blocked Harris operator was
applied to extract the feature points from the reference image.
The reference image was first divided into 10×10 blocks, and
eight Harris feature points were extracted in each block. This
setup detected a total of 800 feature points. The
SSSF
descrip-
tor is computed by setting the template window to different
sizes (i.e., from 5×5 pixels to 40×40 pixels) to analyze the
sensitivities of
SSSF
ncc
with regard to the changes of template
window size. During this process, different canny operator
thresholds (i.e., from 0.1 to 0.3) were set to obtain different
sharpness levels in the contours of the template window. For
the consistency check method, the projective model was ap-
plied to check the mismatched points of the high-resolution
set because of the few local distortions. By contrast, for the
medium-resolution set and map set, the third-order polyno-
mial was selected for error eliminations due to several local
distortions. Finally, the
RMSE
threshold of all the tests was set
to 1 pixel to evaluate the matching accuracy.
According to the data listed above, the construction pro-
cess of the
SSSF
descriptor has two key parameters: the tem-
plate window size and the canny operator threshold. There-
fore, different parameters are set to analyze the sensitivities of
SSSF
ncc
concerning changes of the template window size and
canny operator threshold.
Experimental Details and Assessment Criteria
In the experiments, the blocked Harris operator was first ap-
plied to detect the feature points in the reference image. A
total of 800 feature points were evenly detected over the refer-
ence image. Then, one feature point was extracted from the
Table 1. Descriptions of test data.
Category
Test
Reference Image
Sensed Image
Sensor
Size and GSD
Date
Sensor
Size and GSD
Date
High-resolution set
Optical-SAR 1
ZY-3
1000 × 900, 6 m 2017.06
ALOS
1000 × 900, 6 m 2012.06
Optical-SAR 2
ZY-3
1000 × 900, 6 m 2017.06
ALOS
1000 × 900, 6 m 2012.06
Medium-resolution set
Optical-SAR 3 Landsat5 594 × 594, 30 m 2003.01
ENVISAT 594 × 594, 30 m 2004.03
Optical-SAR 4 Landsat5 594 × 594, 30 m 2003.01
ENVISAT 594 × 594, 30 m 2004.03
Map set
Image-map
BAIDU 695 × 457, 2 m 2016.12 Google Earth 695 × 457, 2 m 2016.12
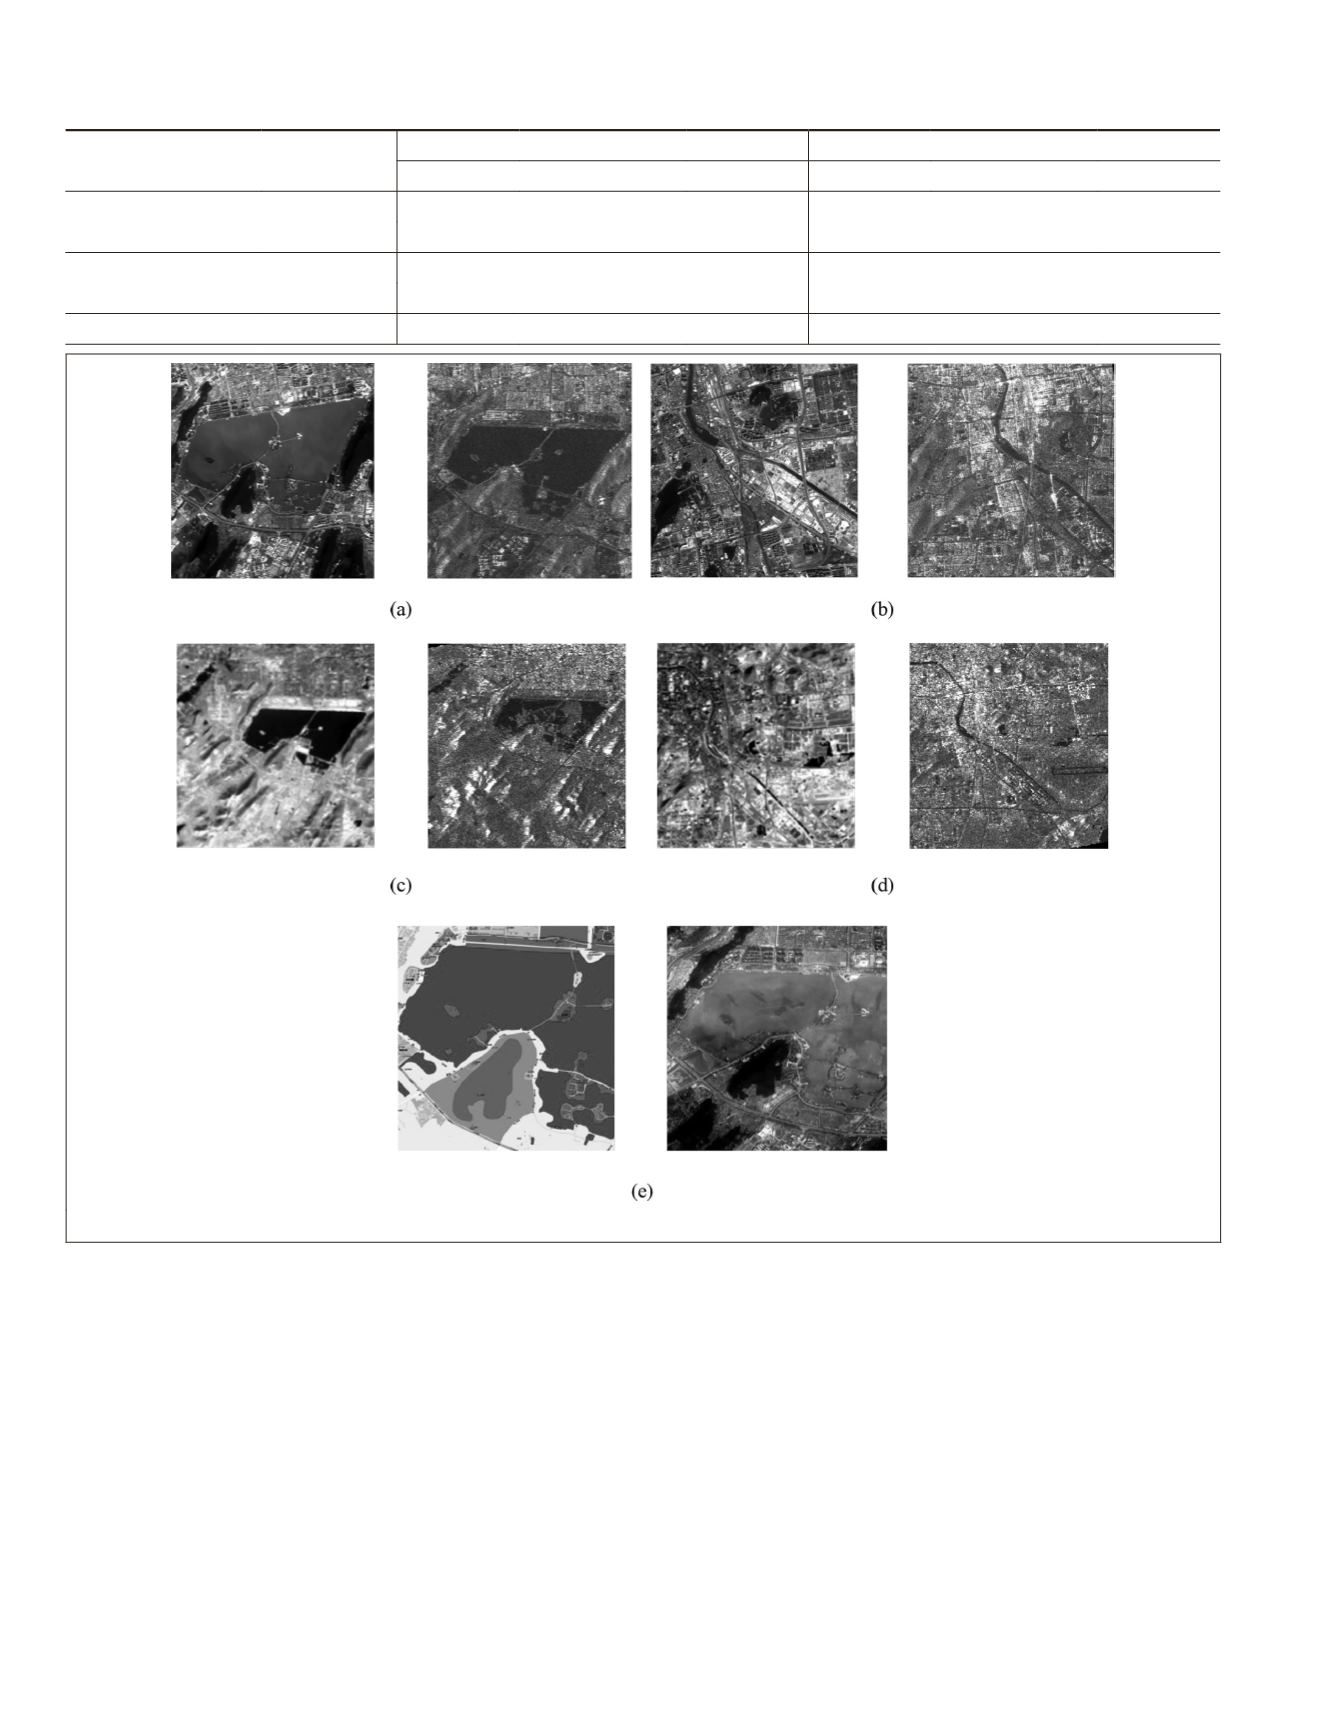
Figure 7. Images for all tests: (a) optical-
SAR
1, (b) optical-
SAR
2, (c) optical-
SAR
3, (d) optical-
SAR
4, (e) map set.
730
October 2019
PHOTOGRAMMETRIC ENGINEERING & REMOTE SENSING


