Results for Dataset A
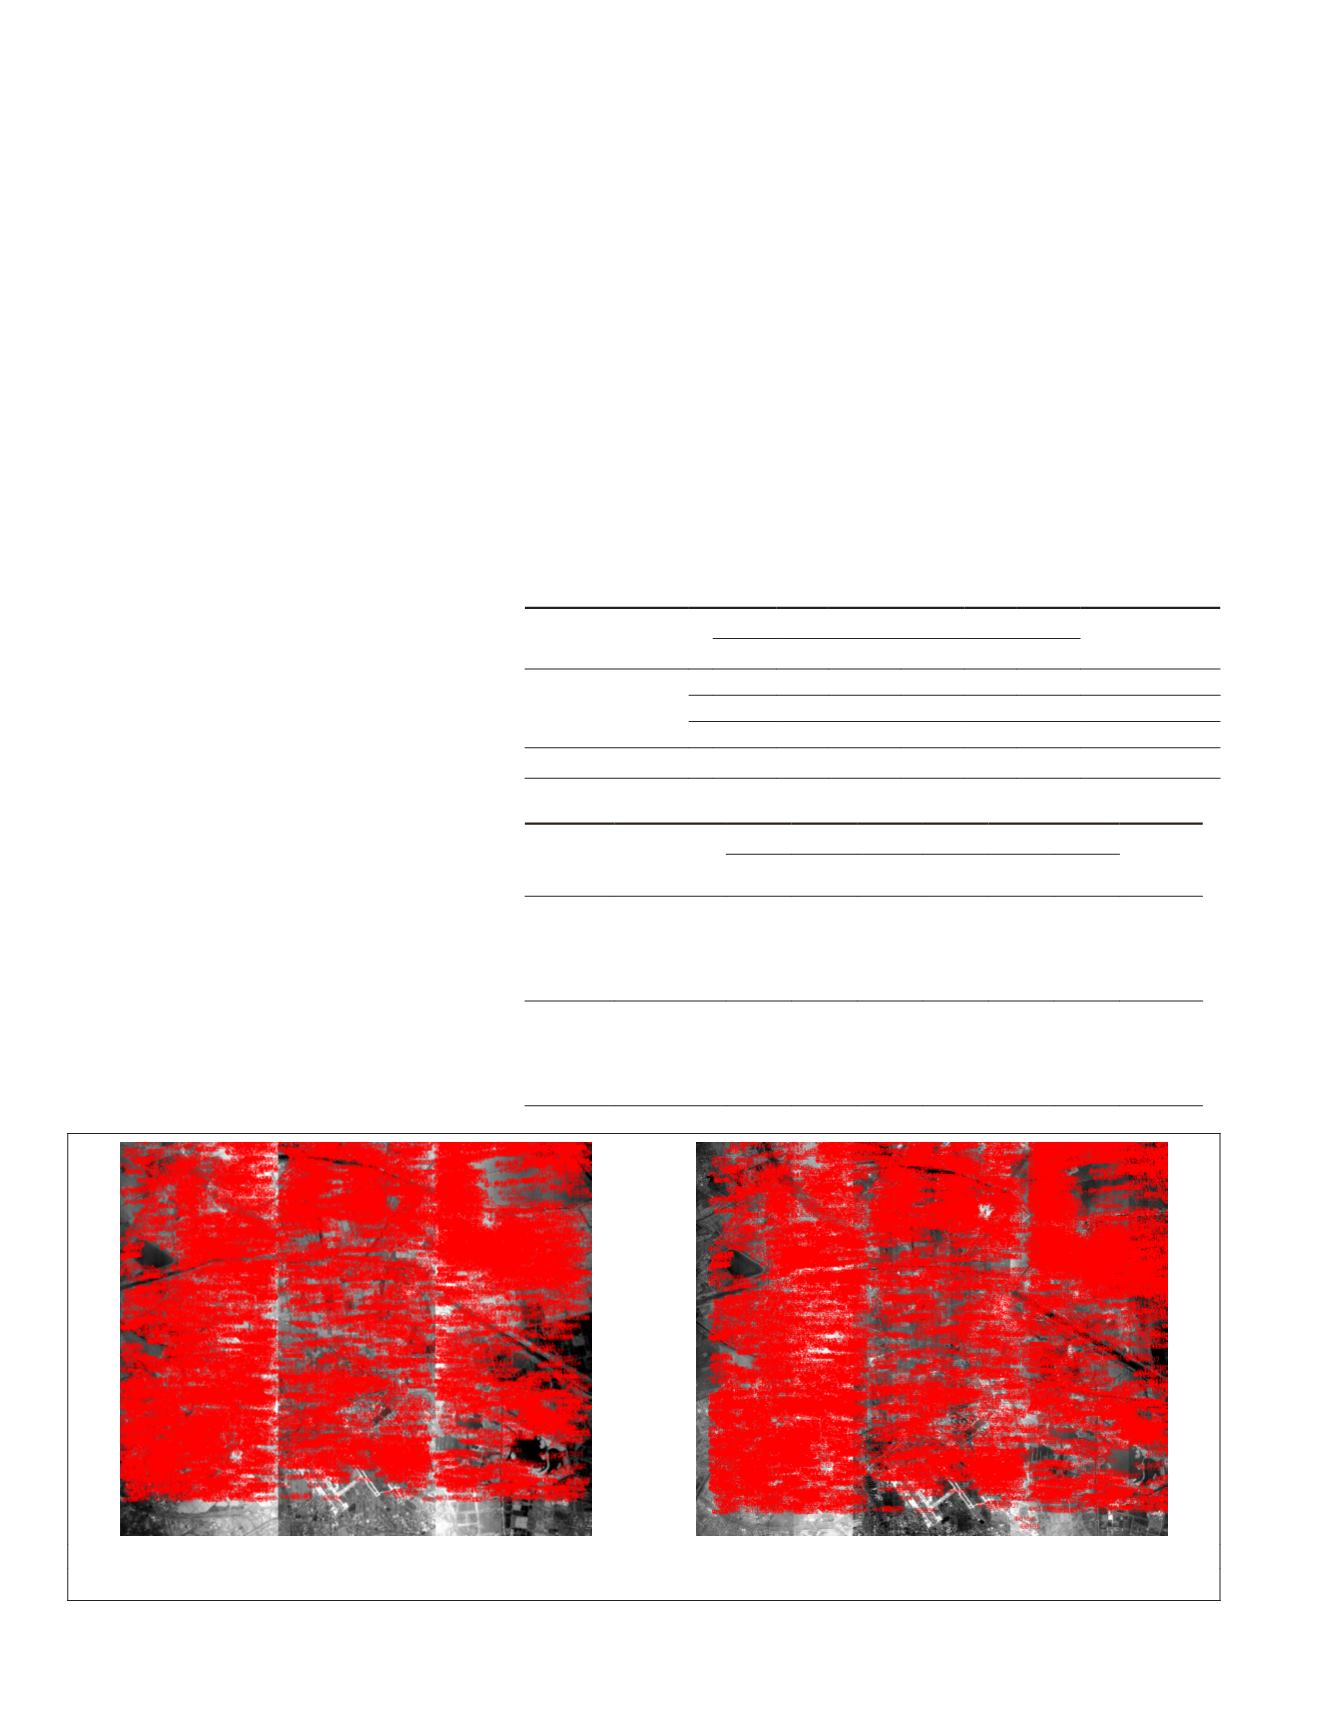
As shown in Figure 4, 12,146 well-distributed conjugate
points were acquired by matching 08-17 2010-Tianjin with
11-14 2011-Tianjin. Moreover, 15,994 conjugate points in
adjacent
CCD
arrays were extracted from 11-14- 2011-Tianjin.
As mentioned earlier, the camera parameters of Yaogan-4
were adjusted on January 2011, invalidating the calibra-
tion parameters obtained in 2010 for 11-14-2011-Tianjin.
Therefore, the interior orientation parameters acquired at
the laboratory were used to construct a geometric model for
11-14-2011-Tianjin before cross-calibration, possibly caus-
ing large interior errors. To validate the effect of the height
error on the cross-calibration, 90 m-
SRTM
and the accurate 1:2
000 scale
DEM
of Tianjin were adopted for cross-calibration.
Table 3 lists the results of the geometric cross-calibration for
11-14-2011-Tianjin with all conjugate points.
Table 3 indicates the intersection accuracy of the conju-
gate points in Figure 4; A denotes the accuracy after solving
only for the offset matrix of 11-14-2011-Tianjin relative to
08-17-2010-Tianjin, whereas B and C represent the accura-
cies after cross-calibration with the 90 m-
SRTM
and 1:2 000
scale
DEM
of Tianjin, respectively. As indicated
by A, even though the solved offset matrix
eliminated the negative effects of the exterior
errors on the intersection, the interior errors of
11-14-201-Tianjin remained, and the conjugate
points could not be positioned at the same loca-
tion. Thus, the intersection accuracy was only
approximately 40 pixels. Both B and C in Table
3 indicate that cross-calibration could effec-
tively compensate for the interior errors, which
reduced the deviation in the intersection from
approximately 40 to 0.01 pixels. The comparison
of B and C implies that the height errors of 90
m-
SRTM
caused deviations of 0.01 pixels in the
cross-calibration; this is inconsistent with the
deviation of approximately 0.14 pixels deduced
using Equation 11. This is because the area of
11-14-2011-Tianjin was flat, where the 90 m
SRTM
may mainly have suffered from systematic
height errors. Thus, a few effects on the cross-
calibration caused by height errors could be
eliminated using the interior orientation model.
In addition, 05-15-2011-Henan and
09-09-2012-Tianjin were utilized to validate the
cross-calibration accuracy of 11-14-2011-Tianjin
by using the data shown in Figure 3 as the control data. First,
29,270 and 54,554 well-distributed control points were ex-
tracted by matching 05-15-2011-Henan and 08-09-2012-Tian-
jin, respectively, for validation by using the
DOMs
. Then, the
positioning accuracy after elimination of the exterior errors
was evaluated using the control points, which can represent
the accuracy of the calibrated interior orientation parameters.
Table 4 compares the accuracies with different interior orien-
tation parameters: A, B, C, and D respectively represent the
accuracies of the geometric model with respect to the interior
orientation parameters obtained at the laboratory, cross-
calibration with 90 m-
SRTM
, cross-calibration with the 1:2 000
scale
DEM
of Tianjin, and the conventional calibration (Guo
et al
., 2014). D denotes the existing conventional calibration
method, which calibrates the orientation parameters by using
very-high-accuracy control data from the calibration fields
(1:2 000 scale
DOM
and
DEM
of Tianjin in the experiment).
The residuals after elimination of the exterior errors are
shown in Figure 5, where
x
denotes the image column, and
y
denotes the image line. According to the characteristic of the
linear-
CCD
-array pushbroom sensor,
y
is also equivalent to the
(a)
(b)
Figure 4. Distribution of conjugate points: (a) 08-17 2010-Tianjin;(b) 11-14 2011-Tianjin.
Table 3. Accuracy of geometric cross-calibration (11-14-2011-Tianjin).
Calibration scene
Along-track (pixel) Across-track (pixel)
Plane accuracy
(pixel)
Max Min RMS Max Min RMS
2011-11-14-Tianjin
A 22.25 0.00
12.45
91.77 0.00
39.56
41.47
B 0.014 0.00
0.001
0.12 0.00
0.013
0.013
C 0.05 0.00
0.0004
0.05 0.00
0.003
0.003
*Across- and Along-track denote images x and y, respectively.
Table 4. Positioning accuracies with different interior orientation parameters.
Image
Interior
orientation
elements
Along-track (pixel)
Across-track (pixel)
Plane
accuracy
(pixel)
Max Min RMS Max Min RMS
05-15-2011
-Henan
A 21.32 0.00 13.23 92.72 0.00 39.13 41.30
B
2.60 0.00 0.49 2.01 0.00 0.48 0.69
C
1.38 0.00 0.33 2.03 0.00 0.48 0.59
D
1.34 0.00 0.33 2.12 0.00 0.49 0.59
08-09-2012
-Tianjin
A 21.97 0.00 13.22 89.67 0.00 40.33 42.44
B
2.48 0.00 0.56 1.42 0.00 0.46 0.73
C
1.46 0.00 0.47 1.42 0.00 0.46 0.67
D
1.45 0.00 0.47 1.51 0.00 0.47 0.67
490
August 2018
PHOTOGRAMMETRIC ENGINEERING & REMOTE SENSING


