field survey, only trees along the roads were selected for
species classification accuracy analysis. With the average dis-
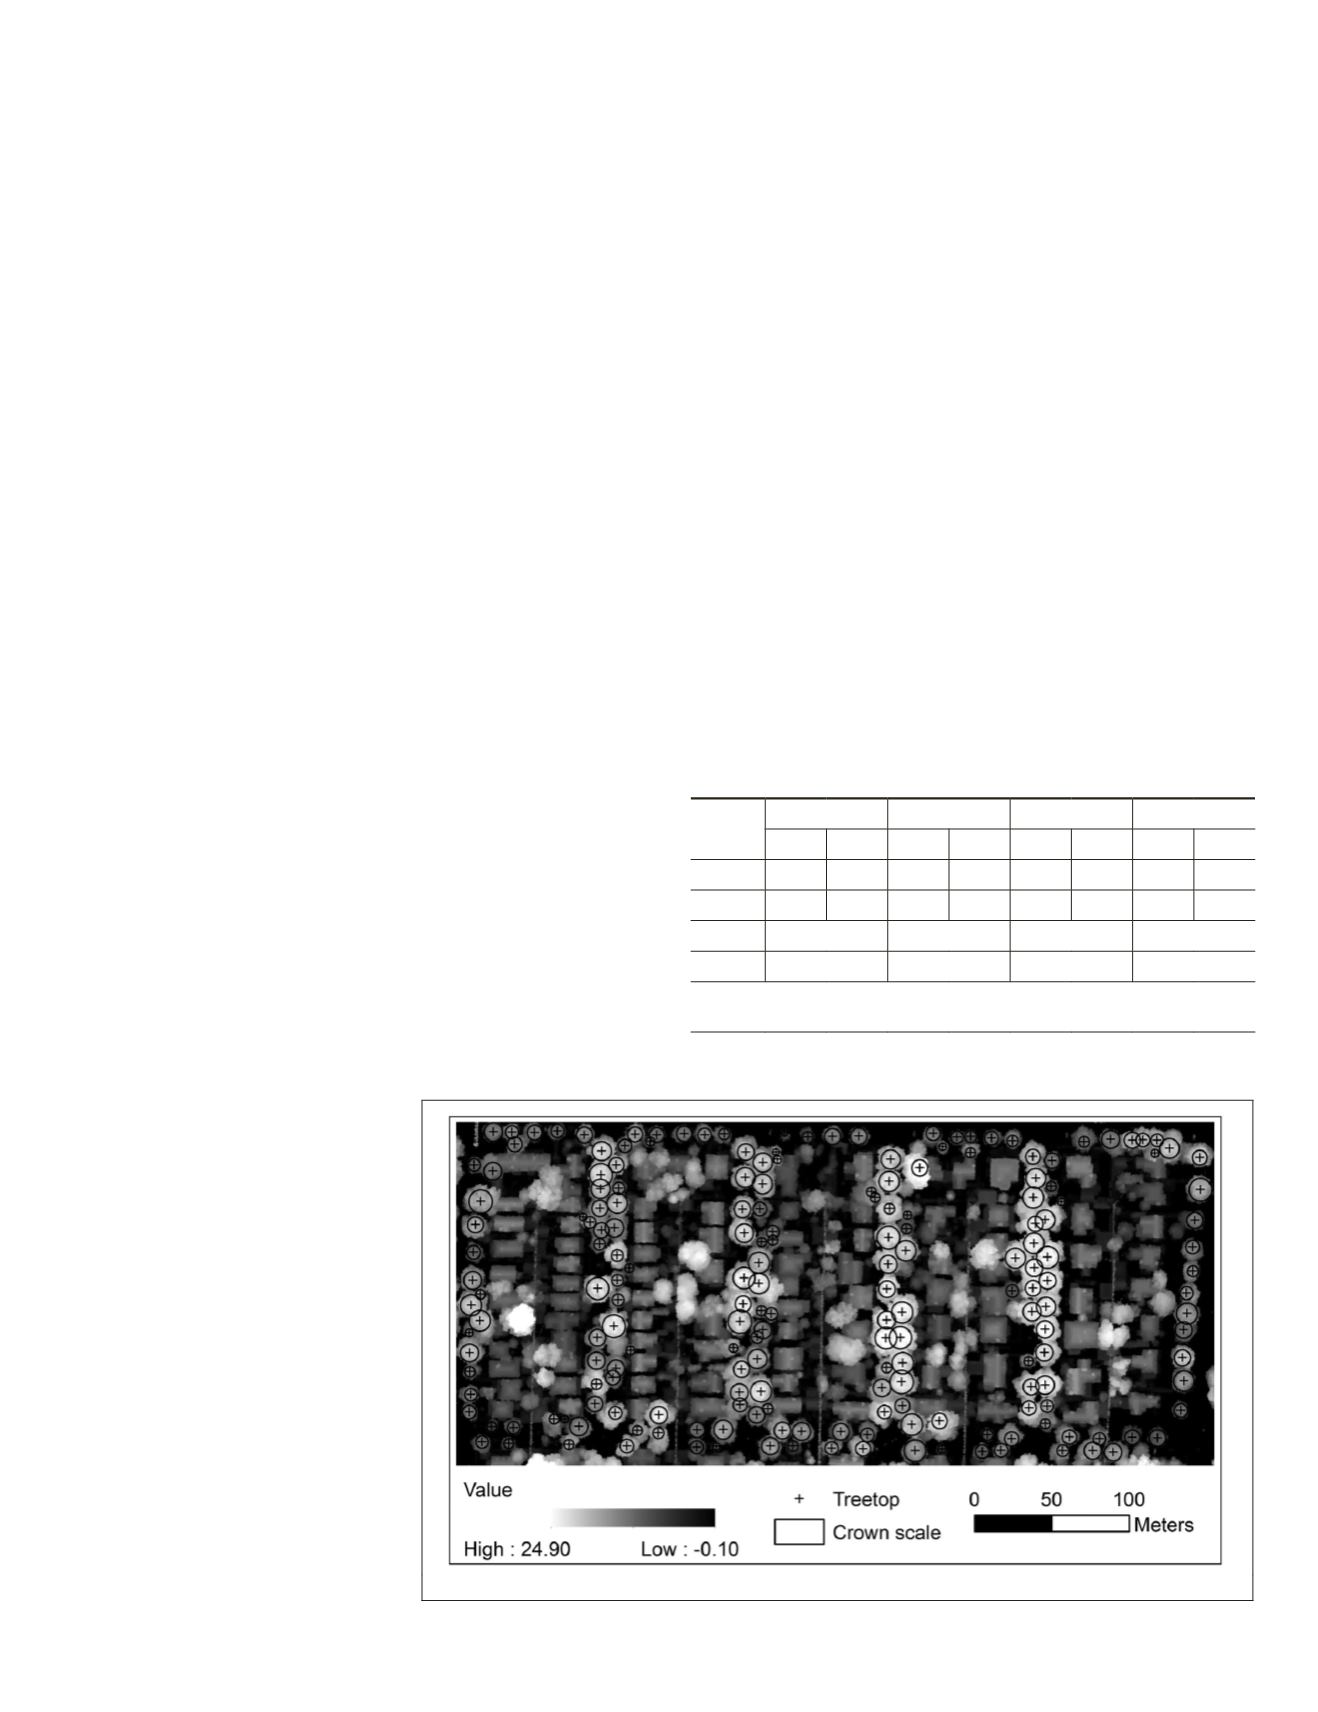
tance between the treetop and its control points as the radius,
the circles centered on treetops were automatically drawn as
crown scales. The identified treetop and crown scales can be
seen in Figure 3.
The average crown radius detected by lidar data is 4.82 m,
ranged from 1.8 m to 7.64 m. Specifically, the average radius
of ash trees was 5.21 m, with standard deviation of 1.40,
while the average radius and standard deviation for non-ash
trees were 4.68 m and 1.35 m. The lidar-derived radii of the
trees explained 65.50 percent of the variances associated with
the field measured crown width. The root mean squared error
(
RMSE
) between field and lidar detected crown radii for all
198 trees was1.52 m (25.01 percent of the field measured radii
mean), but ash trees has a higher
RMSE
(27.53 percent) than
non-ash trees (23.50 percent).
Structural Feature Extraction from Lidar Data
Based on the smooth
CHM
and crown segmentation, three
structural features including tree height, crown shape index
(
SI
), and coefficient of variation (
CV
) were extracted. First, tree
heights were obtained by directly measuring the pixel values
at the treetop locations. The tallest tree reaches 20.62 m and
the shortest one is only 5.97 m, the average height at 14.04
m, 25 out of 198 trees have heights less than 10 m, 172 trees
are distributed between 10 m to 20 m in heights, and only 1
tree has the height over than 20 m. The average height of ash
trees (16.56 m) is different from non-ash trees (13.05 m). The
standard deviation of ash trees is 2.40 m while the value for
non-ash trees is 3.00 m (see Figure 4a). Second, shape indices
were computed with a range between 52.16 and 92.87, and
a mean value of 82.02. Low values of shape indices indicate
the crowns have steep slopes, while higher values represent
the crowns have a relatively flat surface. The large number of
shape indices with higher values illustrates the dominance
of deciduous tree species in the study area. Specifically, the
average
SI
values for ash and non-ash are 87.34 and 80.05,
and the standard deviation of
SI
for ash and non-ash trees are
3.46 and 5.96, respectively, (see Figure 4c).Third, the coef-
ficients of variation were calculated and they are distributed
between 2.15 percent and 21.40 percent with an average of
7.87 percent. These low values of
CVs
in our study indicate
low variability of the heights within a crown. The average
CV
value and standard deviation for ash trees are 5.33 and 1.29,
and 8.83 and 3.00 for non-ash
trees (see Figure 4e). The cor-
responding height,
SI
, and
CV
for
maple, oak, and other species
were distributed in Figure 4b,
4d, and 4f.
The first column is the distri-
bution for ash and non-ash group,
the second column is the distri-
bution for maple, oak, and other
species: (a) and (b) tree height, (c)
and (d):
SI
, (e) and (f):
CV
.
Spectral Feature Extraction from
AISA
Hyperspectral Imagery
Based on the resulted Wilk’s
lambda values, six optimal bands
from the treetop-based spectra
were identified at a 5 percent
level of significance. Of the six
optimal bands selected in the
wavelength region from 409.85
nm to 2494.57 nm, one band was
from the visible region, two were
from the
VNIR
region, and other three bands were from the
SWIR
region. The results indicate that the classified map using
6 optimal bands matches 95.08 percent with the classified
map using all 312 bands. The 6 bands with
SVM
resulted in
66.45 percent of overall accuracy with 0.52 of kappa statistics,
while all 312 bands with
SVM
resulted in 68.38 percent of
overall accuracy with 0.54 of kappa statistics. Since optimal
bands and all bands produced similar classification results,
6 optimal bands were taken up for further treetop-based tree
species classification.
Classification Results
Table 1 reports the classification results for ash trees and
non-ash trees using
SVM
classifier with four combinations
of hyperspectral imagery and lidar data. The spectral only
variables resulted in an overall accuracy of 81.9 percent and
kappa statistics of 0.44, and ash trees were classified with low
producer’s accuracy (43.6 percent) and user’s accuracy (73.9
percent). Adding
TH
into the
SVM
classification improved the
overall accuracy to 83.2 percent and kappa statistics to 0.58,
and the producer’s accuracy of ash trees increased to 74.4 per-
cent but the user’s accuracy decreased to 64.4 percent. Joining
SI
into the classification further increased the overall accuracy
to 87.1 percent and kappa statistics to 0.69, and including
CV
as classification input increased the overall accuracy to 89.0
percent and kappa statistics to 0.72. Especially, fusion of
CV
and optical spectral bands resulted in higher producer’s ac-
curacy of 82.1 percent and user’s accuracy of 76.2 percent for
ash tree species as well as producer’s accuracy of 91.1 percent
and user’s accuracy of 93.8 percent for non-ash trees.
Table 1. Classification accuracies for ash and non-ash trees.
Species
Spectral only Spectral + TH Spectral + SI Spectral + CV
PA UA PA UA PA UA PA UA
Ash 43.6 73.9 74.4 64.4 79.5 72.1 82.1 76.2
non-ash 94.8 83.3 86.2 90.1 89.7 92.9 91.1 93.8
OA
81.9
83.2
87.1
89.0
κ
0.44
0.58
0.69
0.72
OA: Overall accuracy (%); PA: Producer’s accuracy (%);
UA: User’s Accuracy (%);
Figure 3. Treetops and crown scales.
PHOTOGRAMMETRIC ENGINEERING & REMOTE SENSING
August 2018
499


