coniferous and deciduous classes with an overall accuracy of
80 percent. Heinzel and Koch (2011) investigated the second-
ary physical properties of a full-waveform lidar including
pulse width, amplitude and intensity for six tree species
discrimination. Although the conifers and broadleaved trees
were classified with very high accuracy of 91 percent, the
six tree species including pine, spruce, beech, hornbeam,
cherry, conifers, and broadleaved trees were classified with
low accuracy of 57 percent. Yao
et al
. (2012) estimated the
stem volume and diameter at breast height (
DBH
) at the single
tree level and classified coniferous trees and deciduous trees
with higher accuracy based on airborne full-waveform lidar
data, but they did not classify mixed forest. In summary, lidar
data has a great capacity to provide a set of crown structural
variables, and is therefore suitable for distinguishing conifer-
ous and deciduous trees. Lidar data alone, however, is not
sufficient for species discrimination in a biodiverse forest
(Alonzo
et al
., 2014).
For better tree species classifications in a mixed forest, a
number of studies have integrated structural features with
spectral features (Hill and Thomson, 2005; Voss and Sugu-
maran, 2008). Dalponte
et al
. (2008) directly joined the lidar
derived height and intensity information with the 40 selected
bands of
AISA
hyperspectral imagery to classify 23 tree classes
and increased the accuracy by more than 5 percent for five
classes. Jones
et al
. (2010) integrated lidar-derived canopy
height model (
CHM
) and canopy volume profile (
CVP
) data with
hyperspectral imagery at the pixel level to map 11 tree species
in the Gulf Islands National Park Reserve, Canada, and report-
ed improved producer’s (+5.1 to 11.6 percent) and user’s (+8.4
to 18.8 percent) accuracies for dominated species. Dalponte
et al.
(2012) generated 19 height related bands based on lidar
features within each pixel (e.g., maximum, minimum, and av-
erage of height point within each pixel) and joined six optimal
bands with hyperspectral imagery for tree species classifica-
tion at different levels. The results indicated the fusion of
lidar and hyperspectral data increased the classification ac-
curacies at the levels of macro classes, forest types, and forest
species. Moreover, Alonzo
et al
. (2014) extracted 28 structural
metrics from 3D lidar point clouds and fused them with the
spectra information of pixels with
NDVI
values exceeding
0.6 within a crown. The addition of lidar data increased 4.2
percent of overall accuracy compared to spectral data alone.
Although canopy structure variables extracted from lidar data
is able to offer complementary information to optical informa-
tion, the biophysical properties used in previous studies vary
during the plant cycle. For example, tree height increases and
crown size extends as tree grows, and crown volumes may
vary with different crown architectures. Therefore, the con-
tribution of canopy structure to
deciduous tree species classifica-
tion is limited.
Separating ash trees from the
common deciduous trees in an
urban area is a difficult problem
due to the similar spectral prop-
erties among different species,
different growth stages within a
species, and biophysical changes
from human being influences
(San Souci et al., 2009). In our
observation, the ages of most ash
trees in the study area are differ-
ent. These trees correspond to
different
DBH
, tree heights, and
crown sizes. In addition, CVPs
of tree crowns at the same age
may be different due to pruning.
Therefore, the
CHMs
, height metrics, crown size metrics, and
CVPs have limited contributions to ash tree identification.
In contrast, crown shape in urban area, as the silhouette of a
tree, tends to be species specific and remains similar at differ-
ent stages of plant growth (Fassnacht
et al
., 2016; Sterck
et al
.,
2001; Zeide and Pfeifer, 1991). Although the crown shape of
different age or anisotropy is not exactly the same, it is more
invariant to life stage and capture between-species variability
in crown morphology in comparison with absolute crown
size (e.g., tree height, crown width, etc.) (Alonzo
et al
., 2014;
Holmgren and Persson, 2004; Kim
et al
., 2011). In particular,
the similar and relatively flat crown surfaces, subtle variation
of profile, of ash trees with different ages were observed in the
study area. Therefore, the crown shape features may improve
the classification performance for ash trees. This research
sought to analyze the contribution of crown shape related
features in improving ash tree species mapping in decidu-
ous dominated urban environments. The goal of this study is
to improve the overall accuracy of separating ash trees from
non-ash trees to over 85 percent by fusing crown shape and
spectral features. To describe the crown shape, crown shape
index (
SI
) and coefficient of variation (
CV
), corresponding to
height distribution and height dispersion, were extracted from
discrete-return lidar data as the invariant features in tree’s life
cycle in this study, and fused with treetop-based spectra to
improve the ash tree identification in Milwaukee City.
Material and Methods
Study Area
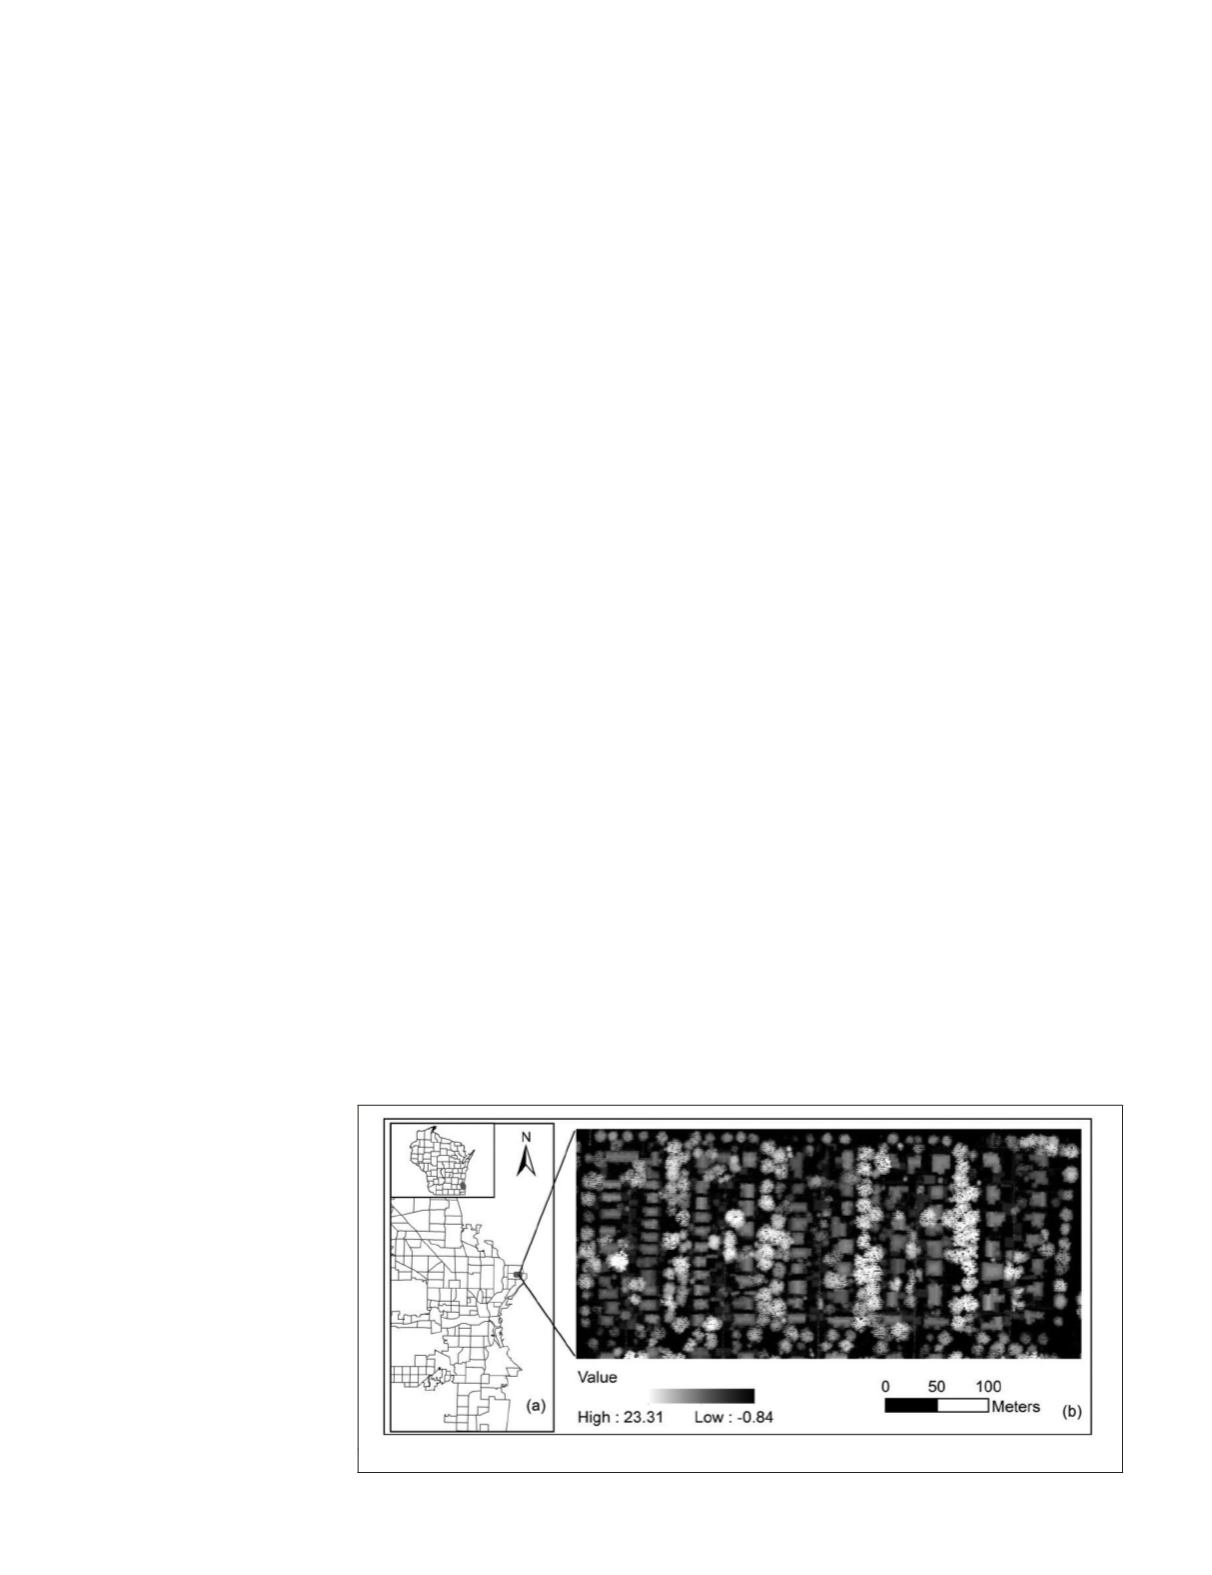
The study area is located in the Upper East Side neighbor-
hood of Milwaukee, Wisconsin (43.07N, 87.87W), covering a
300 m × 700 m area (see Figure 1). As the largest city in the
state of Wisconsin, Milwaukee lies on the western shore of
Lake Michigan and the humid continental climate supports a
diverse mix of urban forest trees. The study area is dominated
by several deciduous trees by street, such as ash (
Fraxinus
spp.), maples (
Acer
spp.), oak (
Quercus
spp.), honeylocust
(
Gleditsia
spp.) and some scattered coniferous trees such as
pine (
Pinus
spp.), and spruce (
Picea
spp). The terrain in the
study area was sculpted by a glacier path. The average eleva-
tion of the relative flat surface is about 200 m above sea level
and tree heights are approximately 5 to 25 m.
Data Set
The airborne imaging spectrometer for application (
AISA
)
hyperspectral imagery was acquired by Terra Remote Sensing,
Inc. (
TRSI
) using an
AISA
hyperspectral sensor in August 2008.
Two strips of images span the study area, and the imagery
Figure 1. Study area in Milwaukee (a) and canopy height model (b).
496
August 2018
PHOTOGRAMMETRIC ENGINEERING & REMOTE SENSING


