Take into consideration the specific species in non-ash
trees, such as maple, oak, and other species, classification ac-
curacies and contributions of the structural features decreased
(see Table 2). The best overall accuracy and kappa statistic
produced by the fusion of spectral and
CV
were 72.9 percent
and 0.61. Even worse, tree height information decreased
the overall accuracy (from 66.5 percent to 64.5 percent) and
kappa statistic (from 0.52 to 0.49). In addition, the highest
producer’s accuracy (75.0 percent) and user’s accuracy (79.1
percent) using fusion method were similar as these (78.6 per-
cent and 77.3 percent) resulted from spectral only data.
McNemar tests indicated that there is no statistically
significant difference between tree height fusion and hyper-
spectral only (
p
= 0.125) at the 95 percent confidence level
in classifying ash and non-ash trees. However, the differ-
ence between
SI
fusion and hyperspectral only is statistically
significant (
p
= 0.008), and so is the difference between
CV
fusion and hyperspectral only (
p
= 0.001). In comparison with
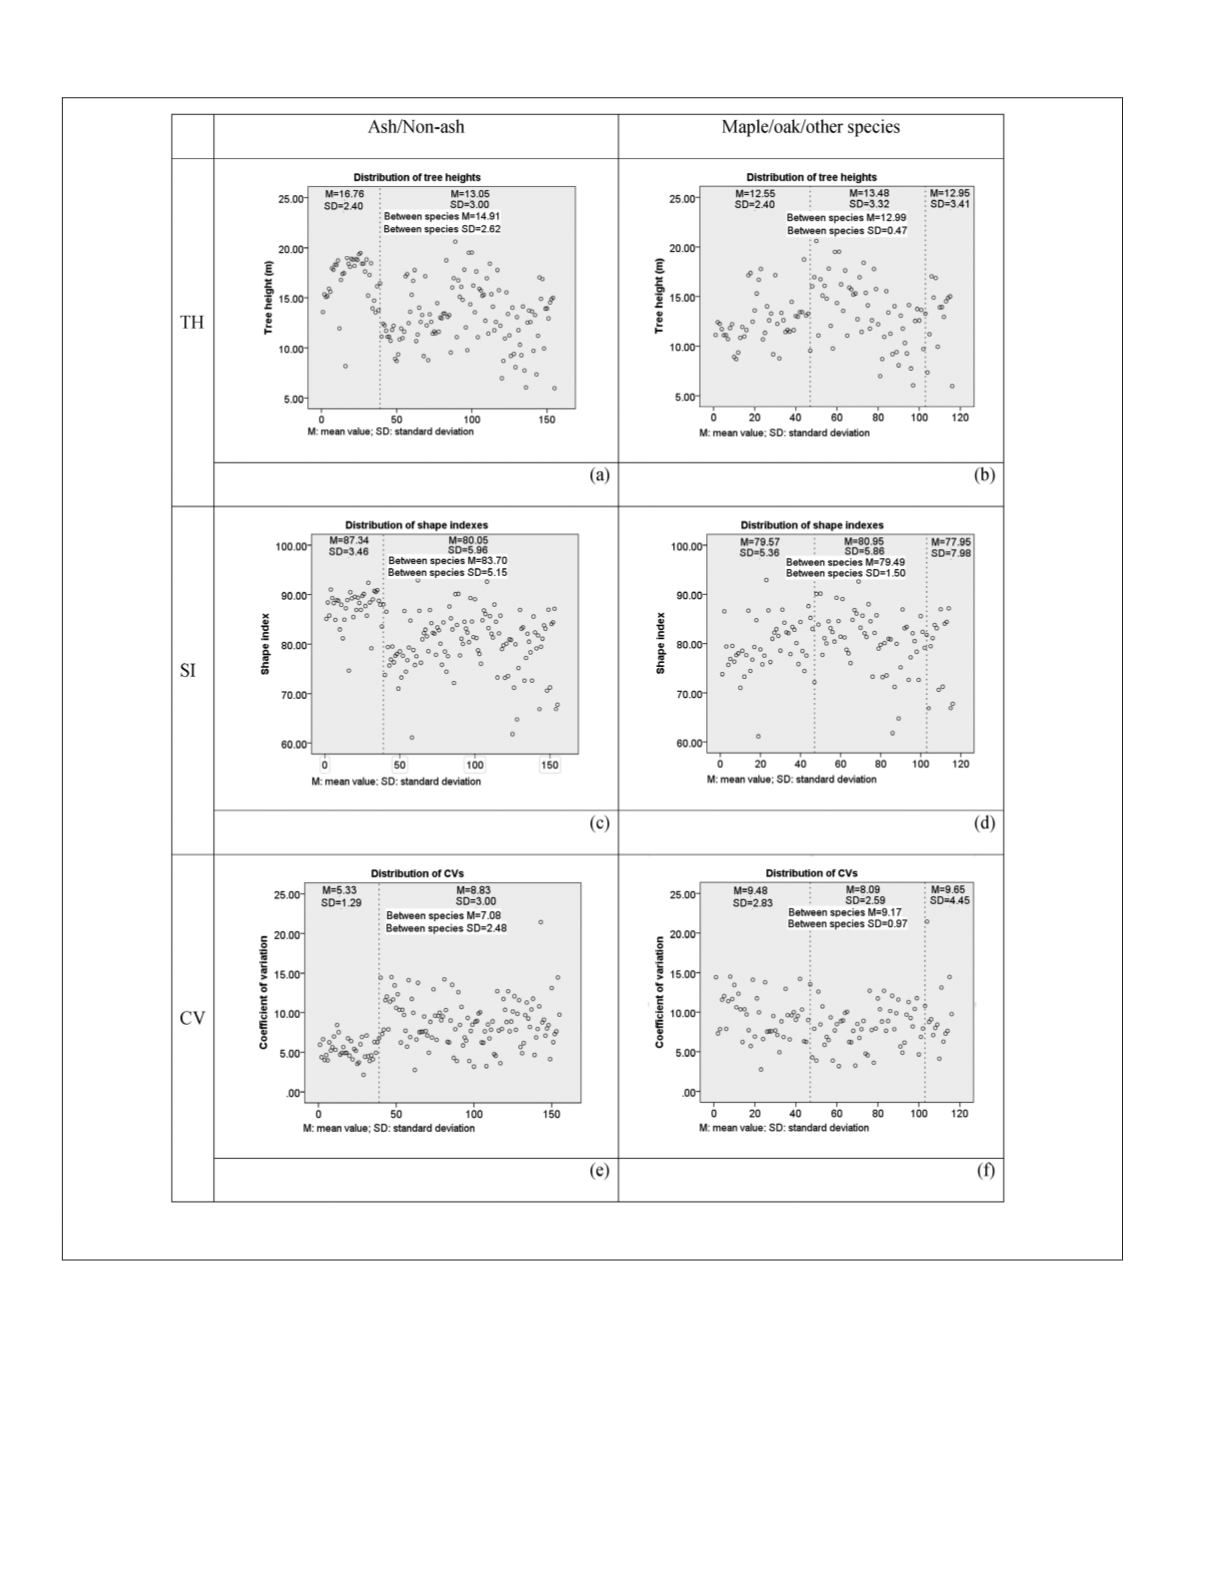
Figure 4. Distribution of tree height, shape index, and
CV
. The first column is the distribution for ash and non-ash group; the
second column is the distribution for maple.
500
August 2018
PHOTOGRAMMETRIC ENGINEERING & REMOTE SENSING


