that the accuracy based on
TLS
is greater than that on
OLS
.
From the third column and fourth column in Table 2, we can
conclude that the camera-external parameters based on
WTLS
more accurately reflect the true data than do those based on
TLS
. In addition, the standard error values of the camera-exter-
nal parameters are 0.56°, 0.21°, 0.07°, 0.01°, and 0.02°. Table
3 gives the specific residual values of the coefficient matrix
A
and observation vector
y
in Equation 3 based on the
WTLS
.
From Table 3, the order of magnitude of the residual in
coefficient matrix
A
(the first through fifth columns) is lower
than the residual in the observation vector
y
(the sixth col-
umn), which indicates that the coefficient matrix should be
viewed with error and that the relative orientation based on
WTLS
is more rigorous theoretically than that based on
OLS
.
To test the relationship between the number of stereo im-
age points and the external parameters of the lunar rover’s
stereo vision system, some experiments should be performed.
Case 1:
Nine Pairs Of Stereo-Matching Points
In this section, nine pairs of image points with uniform dis-
tributions are selected by the
SURF
algorithm and the manual
matching process (Figure 5). The weight matrix
P
can be set
as (ˆ
σ
2
p
/
σ
2
p
)
diag
(1 1 1 0.5 0.5 0.5 0.1 0.1 0.1) in terms of top to
bottom and left to right.
The results are presented in Table 4.
The standard error values of the camera-external param-
eters are 0.51°, 0.19°, 0.06°, 0.009°, and 0.015°. Table 3 gives
the specific residual values of coefficient matrix (Table 5)
A
and observation vector
y
in Equation 3 based on
WTLS
.
Case 2:
Eleven Pairs Of Stereo-Matching Points
In this section, eleven pairs of image points with uniform
distributions are selected by the
SURF
algorithm (Figure 6) and
the manual matching process. Weight matrix
P
can be set as
(ˆ
σ
2
p
/
σ
2
p
)
diag
(1 1 1 0.5 0.5 0.5 0.2 0.2 0.2 0.1 0.1) from top to bot-
tom and left to right.
The results are listed in Table 6.
The standard error values of the camera-external parame-
ters are 0.48° 0.18°, 0.05°, 0.008°, and 0.014°. Table 7 gives the
specific residual values of coefficient matrix
y
and observa-
tion vector
in Equation 3 based on
WTLS
.
From the error
σ
0
in Table 4 and Table 6, we can conclude
that more stereo-matching points result in higher accuracy
regarding the external parameters of the lunar rover’s stereo
vision system.
Lunar Rover’s Visual Localization Results
Experimental Results of the Lunar Rover’s
Visual Localization in the Indoor Test Field
When the lunar rover works on the lunar surface, the telem-
etry data from the inertial measurement unit (
IMU
) cannot
provide the high-precision pose of the rover needed for navi-
gation and obstacle avoidance. Thus, the rover’s localization
accuracy should be studied in the test field on the ground.
The distribution of tie points is a key issue for high-
precision pose estimation of the rover. In our method, the
similarity transformation model takes the 3D coordinates
of tie points as the input. In general, the numerical range of
Figure 4. Stereo-matching image points of the CE-3 lunar
rover’s images. The white crosses “+” represent the matching
image points, which lie at the center area of the images.
Table 2. The external parameters of the lunar rover’s stereo
vision system.
OLS
TLS
WTLS
Truth data
μ
(°)
-2.87
-0.71
-0.68
-0.13
ν
(°)
2.76
-0.44
-0.44
-0.95
φ
0
(°)
-0.09
-0.37
-0.36
-0.31
ω
0
(°)
1.14
-0.28
-0.28
0.45
κ
0
(°)
1.26
1.16
1.16
0.02
σ
0
(mm)
0.107
0.034
0.033
-
Table 3. Residual of coefficient matrix
A
and observation
vector(
y
(
* 10
–3
).
-0.004 -0.012 -0.001 0.001 0.002 -0.224
-0.001 -0.004 0.000 0.000 0.001 -0.077
0.004 0.011 0.001 -0.001 -0.002 0.209
0.007 0.022 0.003 -0.002 -0.003 0.408
-0.014 -0.043 -0.005 0.005 0.007 -0.789
0.008 0.026 0.003 -0.003 -0.004 0.472
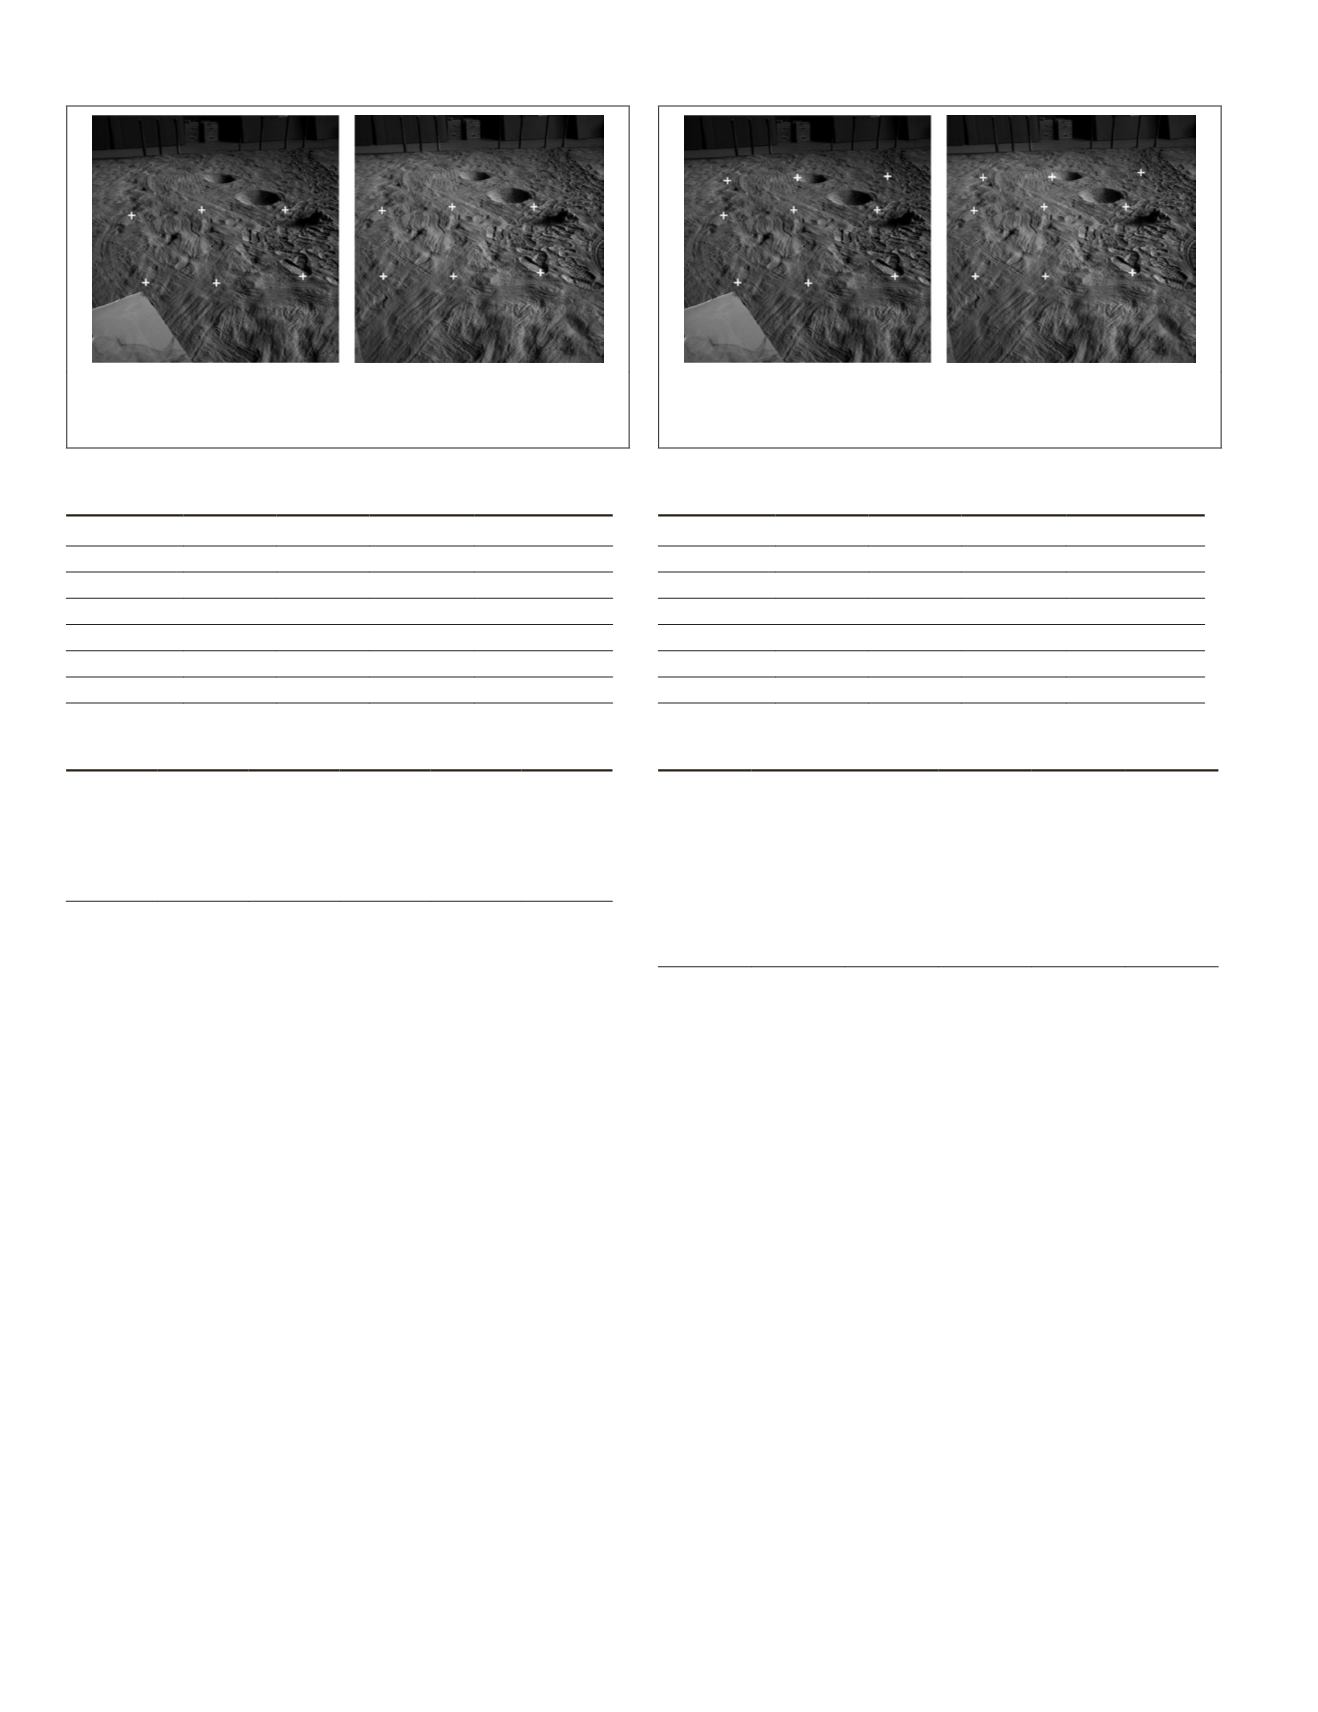
Figure 5. Stereo-matching image points of the CE-3 lunar
rover’s images. The white crosses “+” represent the matching
image points, which lie at the top and center area of the images.
Table 4. The external parameters of the lunar rover’s stereo
vision system.
OLS
TLS
WTLS
Truth data
μ
(°)
-2.46
-0.68
-0.61
-0.13
ν
(°)
2.32
-0.45
-0.49
-0.95
φ
0
(°)
-0.14
-0.36
-0.35
-0.31
ω
0
(°)
1.01
-0.24
-0.20
0.45
κ
0
(°)
1.24
1.12
1.04
0.02
σ
0
(mm)
0.087
0.029
0.027
-
Table 5. Residual of coefficient matrix
A
and observation
vector(
y
(
* 10
–3
).
-0.013 -0.012 -0.010 0.007
0.002 -0.328
-0.003 -0.004 -0.008 0.001 -0.001 -0.150
0.005
0.012 -0.001 0.001 -0.002 0.254
-0.003 -0.015 -0.002 0.002
0.001 -0.218
-0.001 -0.001 -0.001 0.000
0.001 -0.069
0.005
0.012 -0.001 0.001 -0.002 0.221
0.011
0.017 -0.003 -0.002 0.001
0.412
-0.004 -0.050 -0.007 -0.006 0.002 -0.785
0.012
0.027
0.002
0.003 -0.002 0.578
612
October 2018
PHOTOGRAMMETRIC ENGINEERING & REMOTE SENSING


