where
d
b
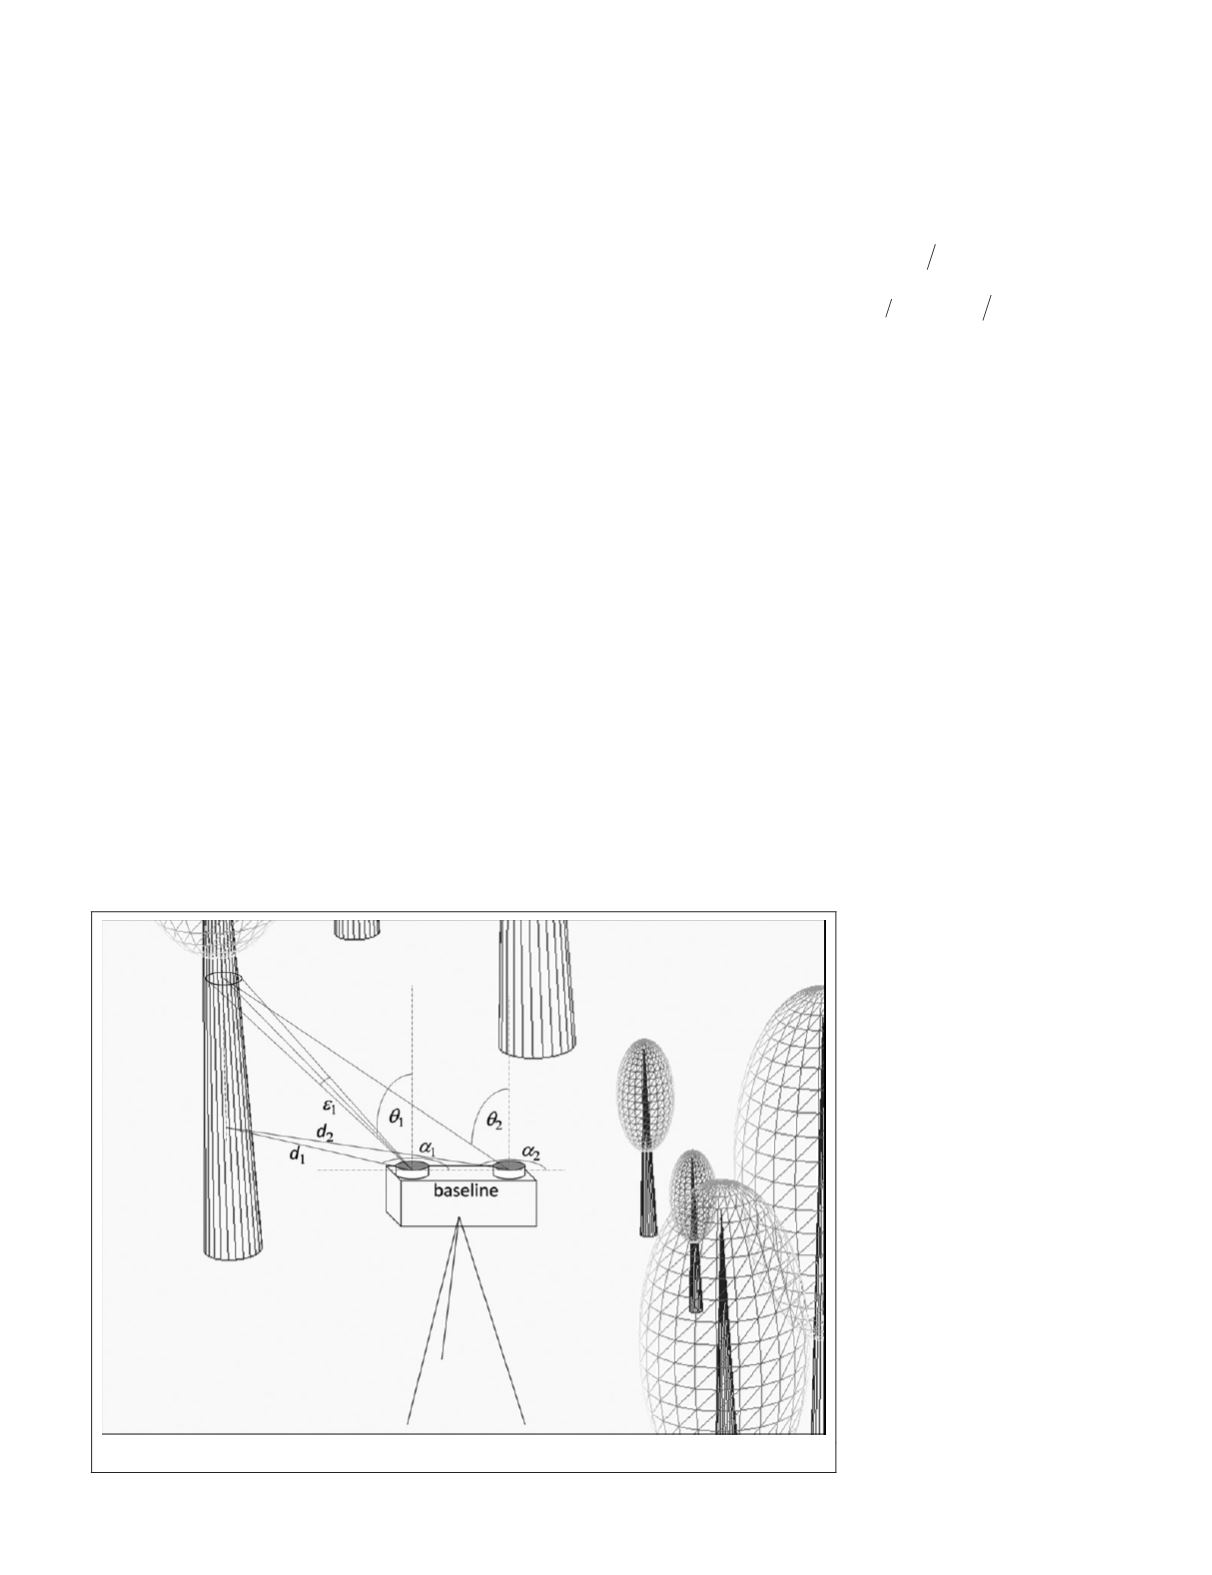
is the distance between the optical axes of the
cameras, and
α
1
and
α
2
are the azimuth angles between the
base-line and the visual to the target point in the images 1 and
2, respectively. The diameter (
D
1
) of each stem section is then
calculated through the covering angle of the stem section in
the left image
ε
1
(Figure 4).
D d
1
1
1
2
2
=
(
)
* *sin /
ε
(2)
The accuracy of the distance calculation is limited in the
proximity of the base line, where
α
1
and
α
2
form a very acute
angle. For this reason, the alignment of trees with the base
line was avoided during image acquisition.
Due to the equidistant projection of fish-eye lenses and the
verticality of the lens optical axis, the zenith direction (
θ
1
and
θ
2
in the left and right images respectively) is proportional
to the projected radius. The height of the stem section with
respect to the lens plane can be determined as:
h d
* cos
sin
=
( )
( )
1
1
1
θ
θ
/
(3)
For each matched section, the correspondence process
provides the azimuth direction, horizontal distance, height
referred to the lens plane, and diameter. To determine each
section height (i.e. the distance to the base of the stem,
H
), a
terrain plane is defined using information self-contained in the
images by fitting the projected horizon line. Species specific
linear taper equations are fitted to the diameter (
D
) and height
(
h
) of the sections obtained in the matching process as follows:
D a b H
i
s
= +
(4)
where
D
is the stem diameter at height
H
from the base of
tree
i
of species
s
,
a
i
is the intercept parameter and
b
s
is the
regression coefficient, which is unique for all trees of the
same species measured in the plot. We are interested in the
diameter at 1.30 m height (
DBH
), necessary
BA
. To calculate the
DBH
of each tree
i
we obtain
D
at H = 1.30
m through Equation 4.
Estimation of Plot Level Variables
To characterize the forest stand structure,
N
and
BA
were used.
These variables are calculated for a circular sample plot of
radius
R
as:
N n
R
=
(
)
*10 000
2
π
(5)
AB DBH
=
(
)
(
)
=
∑
i
n
i
R
1
2
2
2 10 000
π
π
*
Diameter classes of 50 mm intervals were considered, with
the smaller trees accounted for (7.5-12.5 cm)belonging to the
10 cm class. The number of trees in each diameter class is
calculated analogously to
N
.
These variables are estimated from the trees identified
in the ForeStereo images. During measurements, the sensor
resolution limits the maximum range of detection and, as a
consequence, the sampling area, particularly for the smaller
diameter classes. This effect is known as instrument bias. Fur-
thermore, occlusions by nearby stems hamper the detection
of other trees, so shaded sectors should be discounted from
the sampling area (Appendix 1). In this work, plot estimates
calculated according to three methods that treat occlusions
and instrument bias differently have been compared: Relas-
kop-based estimation to deal with instrument bias combined
with the Poisson attenuation model to correct the effect of
occlusions; distance-sampling based correction of instrument
bias and occlusions; and a new method termed hemispheri-
cal photogrammetric correction (
HPC
), that combines the
segmentation based correction for instrument bias proposed
by Sánchez-González
et al.
(2016) with a new approach for
estimation of occlusion probability which adapts the method
proposed by Seidel and Ammer (2014) to the case of stereo-
scopic hemispherical images.
During the image segmentation and correspondence
error from classification of pixels and their
correspondence may occur. Miss-
ing identification of matching trees
leads to some underestimation of
N
,
whereas pixel classification errors
and erroneous matching lead to
stem diameter measurement errors
and affect the estimation of
DBH
and
BA
through the fitting of taper
equations. In addition, since
DBH
is not directly measured at 1.3 m
height in the hemispherical images
(it is estimated through the linear
taper equations) and the height to
the measured sections is derived
from the fitted terrain model (as-
sumed to be plane for the sampling
area), this may contribute to the
estimation error in
DBH
and
BA
es-
timations. The quality of
N
and
BA
estimates was evaluated compar-
ing the outcomes with reference
data measured in the field, through
values of the Pearson correlation
coefficient (r) and bias, calculated
as the mean of differences between
estimated minus field values as a
percentage of the mean value mea-
sured in field (
ME
). The histograms
of diameter distribution were
Figure 4. Representation of ForeStereo geometry.
PHOTOGRAMMETRIC ENGINEERING & REMOTE SENSING
July 2019
497


