r
D
p
r
m
max
sel
image
cos
=
−
( )
( )
*
*sin
π θ α
π
θ α
2
2
2
2
where
D
m
is the mean diameter of the target tree
i
three lowest
sections matched (see full description of the matching process
in Sánchez-González
et al.
2016) and the
θ
(
α
) is the zenith
angle of the viewing direction at each azimuthal direction for
the the third lowest section estimated from all the matched
trees using cubic splines (Sánchez-González
et al.
2016).
The effect of occlusions should be corrected using the
information contained in the sample of apparent (i.e. not
occluded) trees. To estimate the actual nonshaded sampling
area, the theoretical sampling area
A
i
(Equation 17) is multi-
plied by the probability of detection P
i
of each apparent tree
i
.
N
is then computed as:
N
A
i
n
i
i
=
(
)
=
∑
1
10 000
P *
(18)
If
S
0
is the nonshaded area, the probability of detecting tree
0 in a sampling plot of radius
r
max
, considering the potential
shadowing of all other apparent trees is determined as:
P
max
0
0
2
=
S r
/
π
(19)
The term shadowing in this case refers to nondetection
during the matching process. Matching fails to detect or iden-
tify a tree when the stem is partially or completely missed in
any of the two stereo-images. In contrast, the method devel-
oped for application to
TLS
data by Seidel and Ammer (2014)
estimates the shadowed area for a single scan.
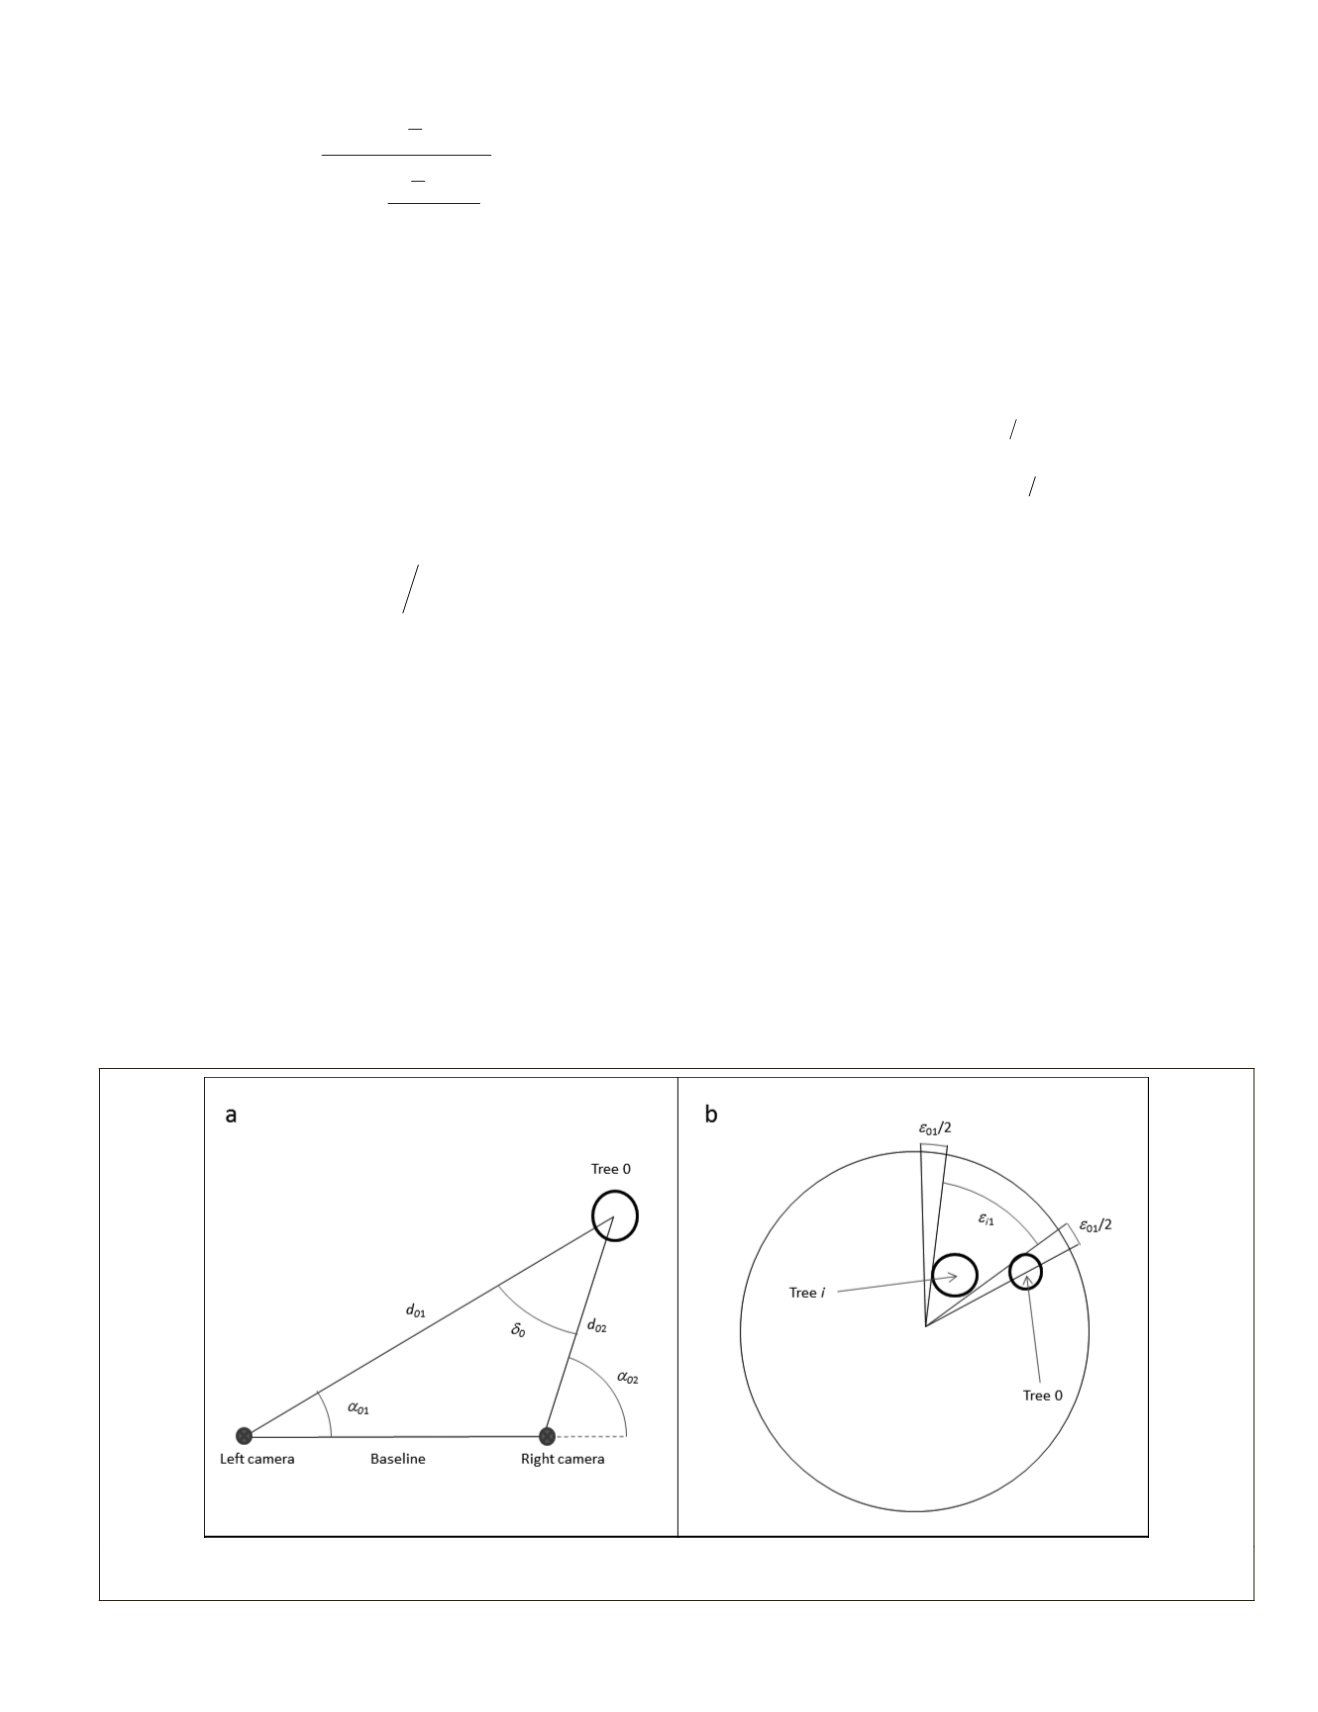
In order to calculate
S
0
, let
d
01
and
d
02
be the horizontal
distances from the left and right cameras to
and analogously
d
i
1
and
d
i
2
the horizontal
left and right cameras to tree
i
, (
i
= 1
…
n
,
of apparent trees).
S
0
can be computed as t
circumference length, from
d
01
= 0 to the maximum sampling
radius
r
max
(remember
r
max
depends on the tree size) multiplied
by the probability of no occlusion at
d
01
:
S d
d d
r
max
0
0
01
01
01
2
=
( )
∫
* *
π
P d
(20)
For each distance
d
01
, the probability of no occlusion P(
d
01
)
is the product of no occlusion probability in the left image
P(
S
01
) and no occlusion probability in the right image, condi-
tional on being visible in the left image P(S
02
|S
01
):
P
P P( |
d
S S S
01
01
02 01
( )
=
( )
⋅
)
P
S S
01
01
2
( )
=
π
(21)
P
S S S S
02
01
02 01
|
(
)
=
where S
01
is the angle where there is no occlusion in the
left image and
S
02
is the angle where there is no occlusion in
the right image conditional on being visible in the left image.
In order to calculate S
01
and S
02
, let
ε
01
and
ε
02
be the angle
span covered by tree 0 in the left and right images respective-
ly (Figure 5b)—and analogously
ε
i
1
and
ε
i
2
for tree
i
. S
01
equals
a complete sampling round 2
π
minus the sum of occlusion
angles in the left image
ο
i
01
produced by all shading trees
i
closer to the device (Equation 22, where I(
d
01
<
d
i
1
) equals 1 if
d
01
<
d
i
1
and 0 in any other case).
S
d d
i
i
01
01
01
1
2
= −
⋅
<
π
Σ
(
(
))
ο
I
(22)
Likewise,
S
02
can be computed as the difference of the
visible angle in the left image
S
01
minus the sum of occlusion
angles
ο
i
02
of trees located closer to the device:
S S
d d
i
i
02
01
02
02
2
= −
⋅
<
Σ
(
(
))
ο
I
(23)
ion angle produced by tree
i
(
ο
i
01
) is the angle
is totally or partially shaded by tree
i
, calcu-
f covering angles:
Figure 5. (a) Angular displacement
δ
0
between tree 0 projection in the left and right images and (b) tree
i
(with covering angle
in the left image
ε
i
1
) shading angle over tree 0 (with covering angle
ε
01
).
PHOTOGRAMMETRIC ENGINEERING & REMOTE SENSING
July 2019
499


