the results from related works as reference (Jaakkola
et al.
2010; Wallace
et al.
2012; Glennie
et al.
2013; Torres and
Tommaselli 2018). Later, under Postprocessing Synchroniza-
tion Results: The Estimation of Clock Differences and
LSM
Re-
finement, we present the estimated clock differences and their
respective standard deviations obtained with the proposed
postprocessing synchronization. The standard deviation (pre-
cision) of the clock differences, estimated with the synchroni-
zation method, and the accuracy of the generated point cloud
were used as performance criteria to compare the proposed
postprocessing technique with other approaches presented
in previous related works. The second assessment evaluated
the improvements with boresight correction and the proposed
LSM
refinement in the generation of the
ALS
point cloud using
the postprocessing synchronization. Four experiments were
performed, analyzing the absolute accuracy of the
ALS
point
cloud. The experiments have the following features:
• Experiment A used postprocessing synchronization by cor-
relation only.
• Experiment B applied postprocessing synchronization by
correlation followed by
LSM
refinement.
• Experiment C used postprocessing synchronization by cor-
relation with boresight-angle correction.
• Experiment D applied postprocessing synchronization by
correlation followed by
LSM
refinement and boresight-angle
correction.
Regarding experiments C and D, two sets of boresight
misalignment angles were estimated because the estimated
clock differences varied. The angles were computed as
described already under Calibration of the
ALS
using ten
independent
GCPs
selected considering well-defined features
(ground objects and building edges) and a homogeneous
distribution in the test area to assure proper geometry for
angle estimation. The estimated boresight misalignment
angles (
d
ω,
d
φ
,
d
κ
) obtained for experiment C were
d
ω
= 3°15
′
27.26
′′
,
d
φ
= −0°53
′
26.73
′′
, and
d
κ
= −1°28
′
24.57
′′
,
with estimated standard deviations of
σω
= 0°31
′
54.14
′′
,
σφ
= 0°29
′
54.75
′′
, and
σκ
= 1°26
′
28.21
′′
. The estimated
boresight misalignment angles for experiment D were
d
ω
= 3°11
′
51.84
′′
,
d
φ
= 0°46
′
25.64
′′
, and
d
κ
= −1°21
′
44.01
′′
,
with standard deviations of
σω
= 0°31
′
14.31
′′
,
σφ
= 0°29
′
21.99
′′
, and
σκ
= 1°25
′
39.43
′′
. The estimated kappa
standard deviation is close to the kappa value, which can be
explained by the small number of control points available for
the boresight estimation and also by the quality of the heading
angles provided by the inertial navigation system.
The point clouds from all experiments were computed
with the laser mathematical model implemented in software
developed in-house using C++ by Torres and Tommaselli
(2018). The synchronization method (see Clock-Difference
Estimation and Off-Line Synchronization),
LSM
refinement
(see Refinement by the Least-Squares Method), and boresight-
angle estimation were implemented as
MATLAB
scripts.
Quality control of the point clouds generated in the four
experiments was performed with
GCPs
and separated analyses
for altimetric accuracy (see Point-Cloud Altimetric Quality
Control) and planimetric accuracy (see Point-Cloud Planimet-
ric Quality Control). The mean, standard deviation, and root-
mean-square error (
RMSE
) were used to evaluate the point-
cloud accuracy.
Point-Cloud Altimetric Quality Control
Altimetric quality control estimates the discrepancies in
altitudes by comparing the
GCPs
with the digital terrain model
from the laser point cloud. In this step, 13
GCPs
were used that
were not used in the planimetric control of the laser point
cloud. The altimetric quality control was performed with the
free software LAStools using the lasground and lascontrol
functions (Rapidlasso, Gilching, Germany; available at http://
. The lasground function was used to clas-
sify the point cloud, leaving only the ground points. Then a
triangulation was performed with the lascontrol function in
the ground-classified laser point cloud, producing a triangular
irregular network to estimate the altitude differences of the
digital terrain model generated with the laser point cloud in
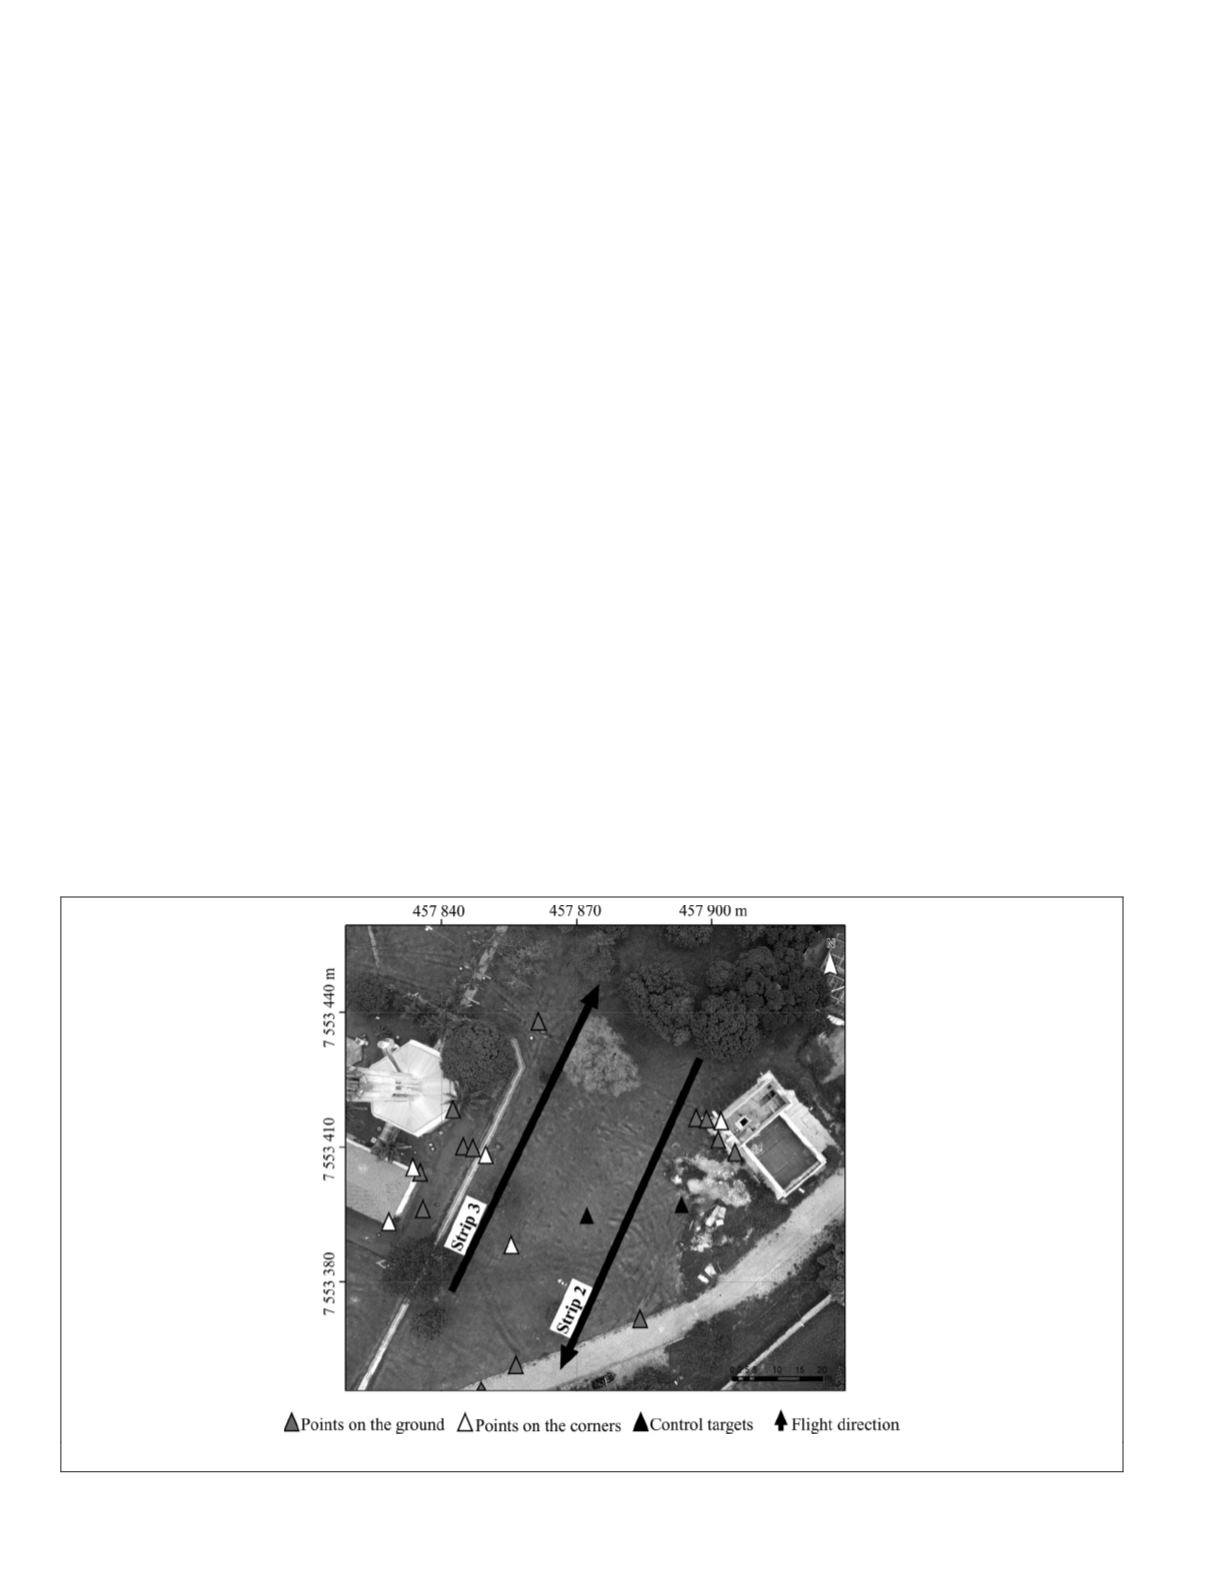
relation to the control points. Thirteen altitude discrepancies
Figure 4. Distribution of control points for quality control of the laser point cloud.
758
October 2019
PHOTOGRAMMETRIC ENGINEERING & REMOTE SENSING


