imbalanced data, various parcel sizes, different agricultural
practices, and acquired by different Sentinel image distribu-
tions. Prediction accuracies are presented using different
feature combinations and both with and without temporal
modeling. The impact of parcel size on the classification ac-
curacy is also studied.
Transition Matrix Assessment
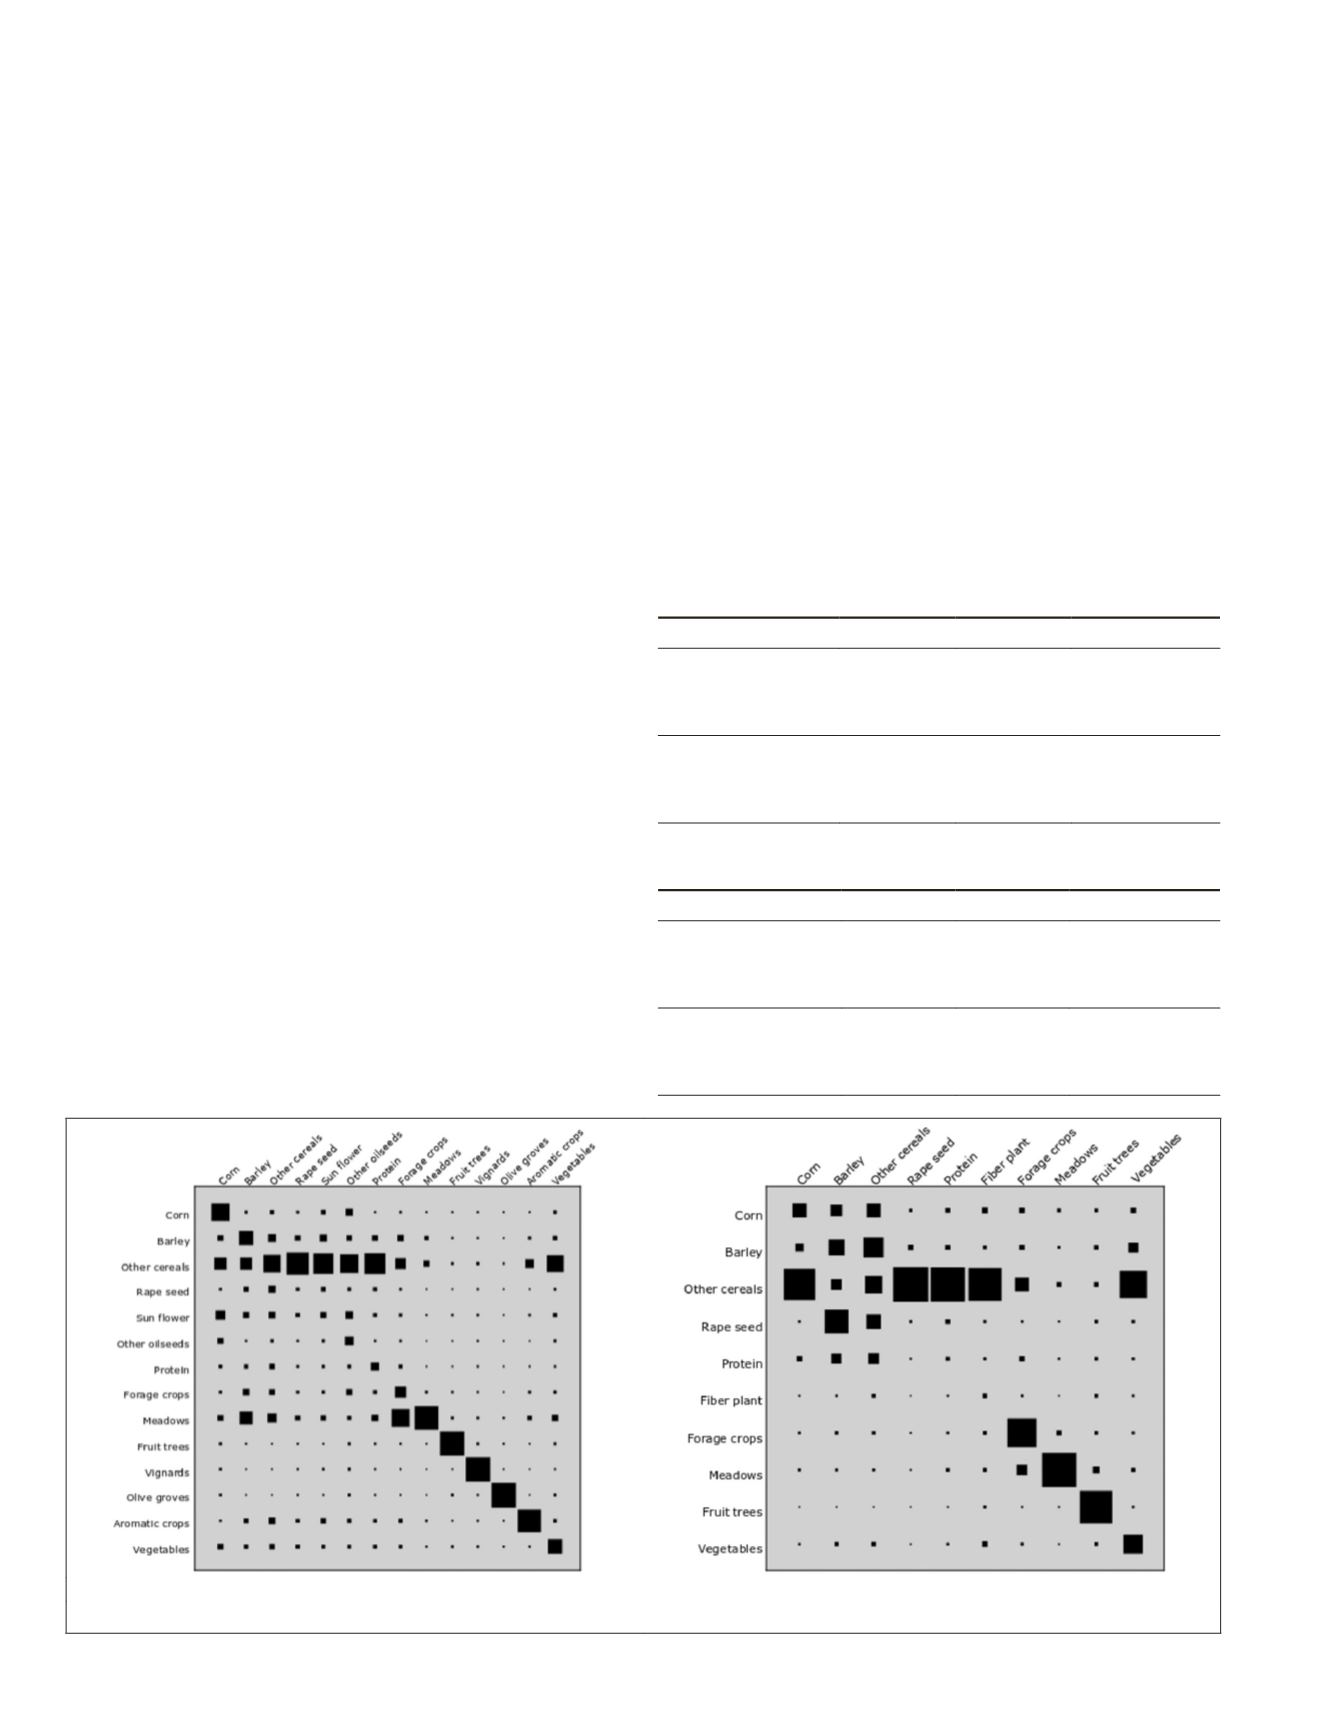
Figure 9 shows the estimated transitions between crop types
as Hinton diagrams for both sites. First order transitions are
normalized by the number of parcels of the initial class (year
n
-
1) which ensures it to be nonsensitive to imbalanced data.
Besides, in case of missing crops, a smoothing is processed
to avoid zeros in the transition matrix (cf. the section “Learn-
ing”). This smoothing may lead to some biases on minor
classes but do not impact the results.
On Site04, the most probable transitions are to and from
permanent crops, such as olive groves, vineyards, orchards,
permanent meadows, and fruit trees reaching 98.34%,
93.87%, 92.72%, 91.89%, and 84.23%, respectively. From
Figure 9, we can observe that the standard rotation patterns
of annual crops are generally not applied in this area. For
instance, the rapeseed, proteins, and sunflowers have prob-
abilities of 76.53%, 66.78%, and 64.25%, respectively to be
transformed to
other cereals
the following year.
On Site77, more transitions are observed for the annual
crops. Agricultural rules for annual crop rotations seem to be
better followed in this area. The rapeseed and proteins have
probabilities of 97.09% and 94.85%, respectively, to be trans-
formed to other cereals the following year. Indeed, rapeseed
→
winter wheat (in other cereals)
→
barley is a well-known
three-year rotation for farmers of this area. Permanent crops
such as meadows and fruit trees have a probability of being
carried over the next year of 94.45% and 81.39%, respectively.
Optical versus Radar Sentinel Time Series
Overall accuracy and F-scores, using different configurations
of optical and radar data, are displayed in Tables 3 and 4 for
Site04 and Site77, respectively.
As reported in Site04 (cf. Table 3), optical data lead to
better results than radar data (+9% for
OA
and +10% for
weighted F-score). This may be explained by a low cloud
cover in this area (Figure 7) and a finer native resolution of
optical imagery that is more suited to small parcel sizes. Table
3 confirms that optical and radar combination led to the best
results when not modeling the temporal structure.
Contrary to the previous site, on Site77 (cf. Table 4), radar
attributes improved the results of optical ones by 7%, achiev-
ing an overall accuracy of 89%. This can be explained by a
combination of frequent acquisition problems and a high cloud
cover in 2016, leading to many missing optical Sentinel-2 data
(cf. Figure 6). In addition, the parcels on Site77 are larger and
thus more compatible with radar Sentinel-1 image spatial reso-
lution. Consequently, using radar imagery solely led to similar
results when combining optical and radar attributes.
Weighted F-scores, using combined radar and optical
images, reached 88% and 71% on Site77 and Site04, respec-
tively. The crop type mappings and prediction errors are
illustrated on Figures 10, 11, 12, and 13 for Site04 and Site77,
respectively for test parcels.
Impact of Temporal Structure
Table 5 and Table 6 display the F-score, the user, and produc-
er accuracy measures per class for both approaches with and
without temporal modeling using combined radar and optical
images on Site04 and Site77, respectively. On Site77, from
Table 6, one can see that high F-scores are obtained for annual
Site04
Site77
Figure 9. Representation of the transition matrices with a Hinton diagram.
Table 3. Site04—Global prediction accuracies, using optical
and radar imagery.
Config
OA
F-score Weighted F-score
No temporal modeling
Radar
0.64
0.59
0.61
Optical
0.73
0.67
0.71
Radar + Optical
0.73
0.68
0.71
Temporal modeling
Radar
0.76
0.60
0.7
Optical
0.78
0.63
0.72
Radar + Optical
0.78
0.64
0.72
Table 4. Site77—Global prediction accuracy, using optical and
radar imagery.
Config
OA
F-score Weighted F-score
No temporal modeling
Radar
0.89
0.73
0.88
Optical
0.82
0.62
0.81
Radar + Optical
0.89
0.74
0.88
Temporal modeling
Radar
0.92
0.78
0.91
Optical
0.87
0.67
0.85
Radar + Optical
0.92
0.76
0.91
436
July 2020
PHOTOGRAMMETRIC ENGINEERING & REMOTE SENSING


