These results confirm that combining optical and radar
data ensures higher crop type prediction accuracy, and lead to
more robust prediction, independently from the study site.
Impact of Parcel Size
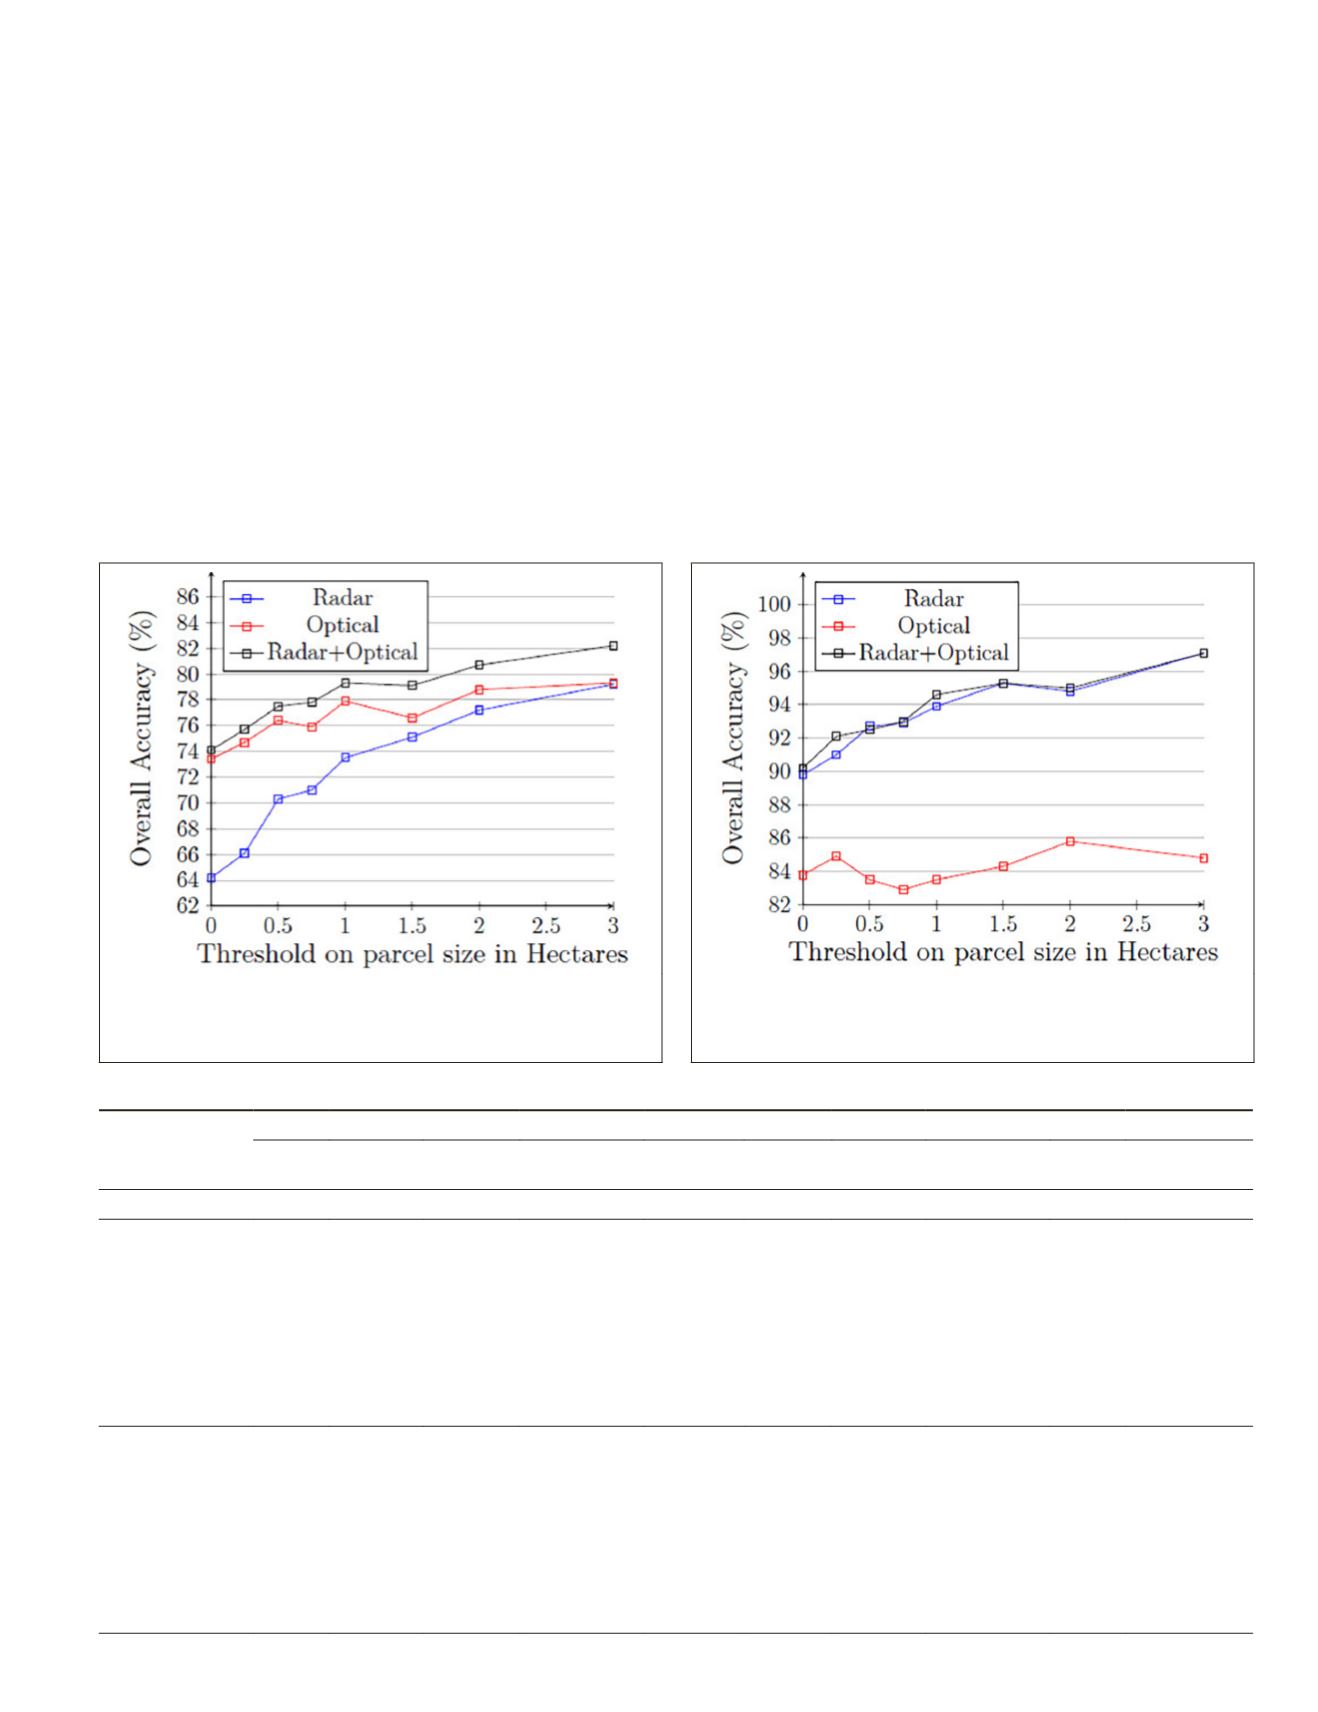
Weighted F-scores on both sites are highly dependent on parcel
sizes as detailed hereby. For both sites, when keeping only large
parcels (area >3 ha), overall accuracies are improved by radar
attributes (+15% and +8.1% for Site04 and Site77, respective-
ly). Indeed, due to the limited spatial resolution of Sentinel-1
images, radar attributes are less robust on small parcel sizes.
In order to make radar data more robust to parcel of lim-
ited sizes, some improvements could be undertaken on radar
data preprocessing. To this end, we used speckle filtering
(Lee 1980) on a restricted local neighborhood (5 × 5). This is
suitable for large parcels as the radar scattering coefficients
are averaged afterwards at the parcel level. However, when
the parcel area is too small with respect to the Sentinel-1
spatial resolution, this method is no longer suitable. Adaptive
radar speckle filtering to small objects should be investigated
(Deledalle, Denis, Tupin
et al.
2015).
For optical attributes, the relation between parcel size and
accuracy is less pronounced. Many factors may impact the
overall accuracy such as cloud cover, data imbalance, and
the parcel size. Indeed, some classes are more represented
in small parcels (0.5–1.5 ha) and are well identified, such as
rapeseed, protein, meadows, and fiber plants. Removing these
small parcels may decrease the overall accuracy.
Combining optical and radar data lead to better results in
all cases, and especially for large parcels. Finally, this sensi-
tivity study confirms the robustness of combined radar and
optical data to the parcel size.
Impact of Temporal Structure
The modeling of temporal structure, i.e., crop rotation model-
ing, improved the global prediction accuracies on both sites.
On Site04 (cf. Table 5), temporally-structured classification
improved the overall accuracy and the weighted F-score by
5% and 1%, respectively. When considering only radar data,
Figure 14. Site04: Impact of parcel size on the overall
accuracy of the classification without temporal modeling.
x
-axis: only parcels whose surface area exceeds the
threshold (in ha) are considered.
Table 8. Site77—Confusion matrices using combined optical and radar attributes.
Ground truth
Corn Barley O. cereals
Rapeseed Protein
Fiber
plants
Forage
crops
Meadows
Fruit
trees
Vegetables
Classification
Optical and radar without temporal modeling
Corn
119
-
-
-
-
-
-
6
-
-
Barley
1
48
2
-
1
-
-
3
-
-
O. cereals
-
2
309
-
-
-
-
19
-
1
Rapeseed
-
-
-
38
-
-
-
3
-
-
Protein
-
-
-
-
27
-
-
1
-
-
Fiber plants
-
-
-
-
1
9
-
-
-
-
Forage crops
-
-
1
-
-
-
-
20
-
-
Meadows
10
1
9
1
-
-
-
276
-
1
Fruit trees
-
-
-
-
-
-
-
12
-
-
Vegetables
1
-
1
-
-
-
-
1
-
27
Structured optical and radar
Corn
118
1
1
-
-
-
3
2
-
-
Barley
1
48
5
-
-
-
-
1
-
-
O. cereals
-
2
321
1
-
-
-
7
-
-
Rapeseed
-
-
1
39
-
-
-
1
-
-
Protein
-
-
1
-
27
-
-
-
-
-
Fiber plants
1
8
-
-
1
-
-
-
-
-
Forage crops
-
1
2
-
-
-
13
5
-
-
Meadows
4
-
4
-
-
-
1
289
-
-
Fruit trees
-
-
-
-
-
-
-
-
12
-
Vegetables
19
-
2
-
-
-
-
-
-
9
Figure 15. Site77: Impact of parcel size on the overall
accuracy of the classification without temporal modeling;
x
-axis: only parcels whose surface area exceeds the
threshold (in ha) are considered.
PHOTOGRAMMETRIC ENGINEERING & REMOTE SENSING
July 2020
439


