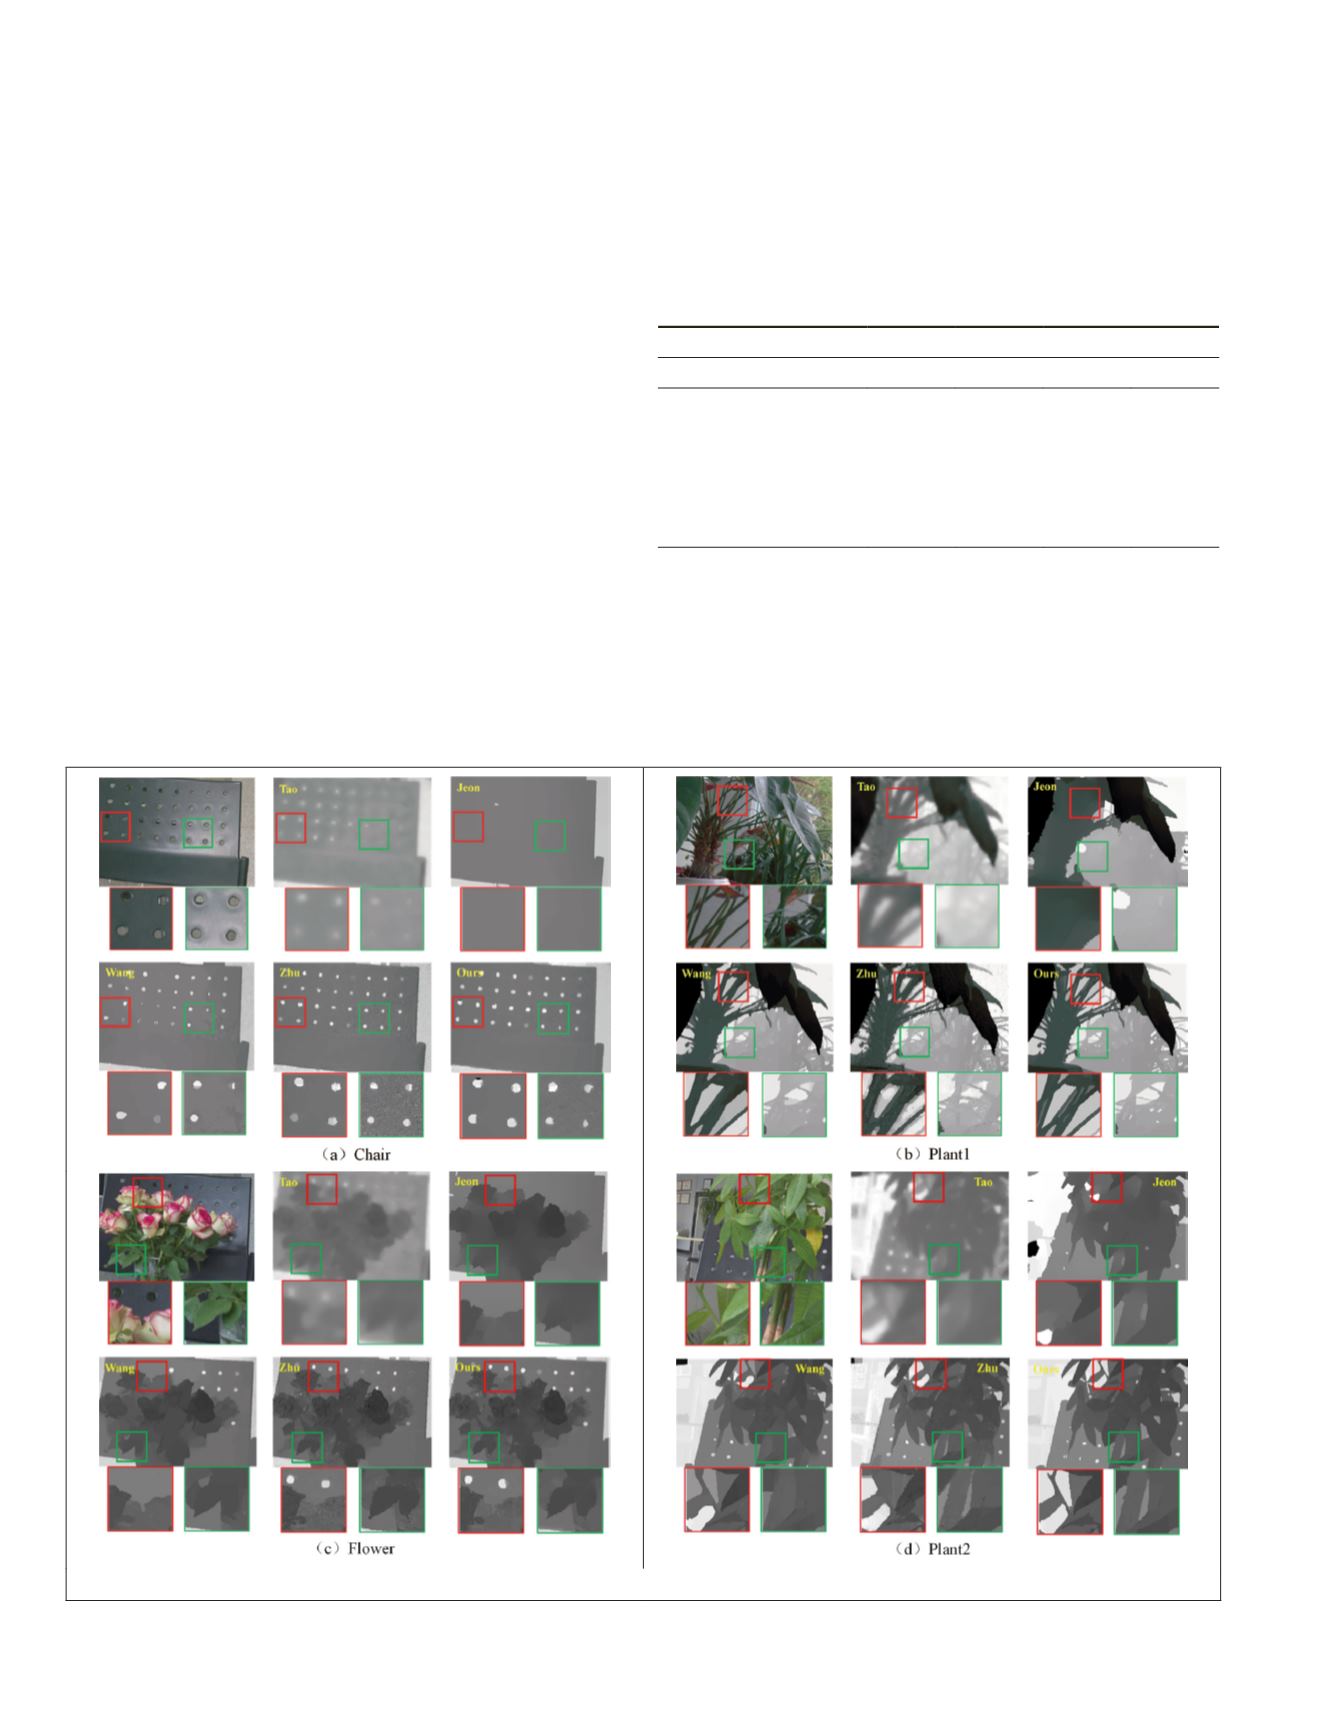
The experimental results of the real scenes are shown in
Figure 23. The method of Tao
et al.
can roughly extract the
basic contour of the scenes, but the depth map is oversmooth.
The method of Jeon
et al.
provides oversmooth results and
fails to extract the occlusion boundaries. On the whole, the
depth maps obtained by the methods of T.-C. Wang
et al.
and
Zhu
et al.
are similar to that obtained by our method. To better
illustrate the advantages of our method, we scale up the depth
of some heavy occlusion areas. From the enlarged close-up
images, it can be seen that our algorithm can preserve the
occlusion boundaries well, especially for thin objects. For
example, the method of T.-C. Wang
et al.
does not reconstruct
all the holes in the chair (Figure 23a), and the accuracy of
the method of Zhu
et al.
is less than ours; the branches in
the red box of Figure 23b are not separated by either of those
methods, but they are clearly distinguished by ours. The thin
leaves in the green box of Figure 23b are oversmooth by the
method of T.-C. Wang
et al.
, and the leaves reconstructed by
the method of Zhu
et al.
are thicker than real leaves; however,
our method reconstructs thin leaves. The leaves in the green
box of Figure 23c are oversmooth by the method of T.-C. Wang
et al.
, and the branches in the red box of Figure 23d are over-
smooth by the methods of both T.-C. Wang
et al.
and Zhu
et
al.
, whereas our method restores fine branches.
The Kinect camera could not provide a refined depth map
for a complex occlusion scene like Figure 22c, but we can
get an accurate depth value of some pixels in the depth map
to compute the depth error. The quantitative comparisons of
the
RMS
error of the depth maps are listed in Table 7. It can
be seen from the table that the depth error of the methods of
Tao
et al.
and Jeon
et al.
method is large, which is consistent
with the phenomenon of oversmoothing of the two methods
in Figure 23. The accuracy of the methods of T.-C. Wang
et al.
and Zhu
et al.
are lower than ours, which proves the effec-
tiveness of our method. The
RMS
error decreases by about 9%
with our proposed method compared with the best of the four
methods.
Table 7. Root-mean-square error (mm) of the depth maps.
Data Set
Method
Chair
Plant1 Flower Plant2
Tao
et al.
(2013)
382.256 189.829 165.388 175.267
Jeon
et al.
(2015)
108.246 95.562 67.280 97.476
T.-C. Wang
et al.
(2016)
89.952 52.987 65.570 68.595
Zhu
et al.
(2017)
67.848 51.953 53.795 72.821
Ours
58.019 49.176 50.354 63.176
In addition, experiments were conducted on the real data
sets of the light-field camera provided by Stanford University
(Raj, Lowney, and Shah 2016). Since there is no ground truth
in the real-scene data, we replace the ground-truth depth with
the depth map provided by commercial Lytro Illum software.
Only qualitative comparisons are conducted, shown in Figure
24. It can be seen that there are a lot of single-occluder and
multi-occluder areas in the real-scene images captured by
Figure 23. Comparisons of depth maps from the real-scene images.
454
July 2020
PHOTOGRAMMETRIC ENGINEERING & REMOTE SENSING


