In the field of terrestrial soil erosion research using remote
sensing technology, there are a number of methods being uti-
lized for discriminating gully features. Metternicht and Zinck
(1998) mapped soil erosion features by image classification using
Landsat
TM
and
JERS-1 SAR
data; Vrieling
et al
. (2007) discerned
erosion gullies frommultitemporal
ASTER
imagery. However, ad-
equate training areas are required for training the classifiers in the
two methods. De Asis
et al
. (2008) delineated potential erosion
areas by applying linear spectral un-mixing method to Landsat
Enhanced Thematic Mapper images, and this method requires
determination of end-members before un-mixing, which needs in-
depth knowledge of the study area. Knight
et al.
(2007) used
AS-
TER
imagery to map alluvial gullies associated with large tropical
rivers, but only reached an accuracy of approximately 50 percent
for the gully class. Shruthi
et al
. (2011) employed an object-orient-
ed image analysis method to extract gully erosion features, using
a combination of
DTM
, spectral, shape and contextual information
obtained from Ikonos and GEOEYE-1 data. d’Oleire-Oltmanns
et
al
. (2014) applied object-based image analysis to detected gully-
affected areas using multispectral QuickBird-2 satellite image, but
detection cannot perform well for small scale gullies. Recently,
several studies on gully detection from airborne Light Detection
and Ranging (lidar) or terrestrial laser scanner data have been pub-
lished (James
et al
., 2007; Eustace
et al
., 2009; Evans and Lindsay,
2010; Baruch and Filin, 2011; Sofia
et al
., 2011; Höfle
et al
., 2013).
As revealed by a recent comparative study (Yue
et al
., 2014),
the morphometric parameters of Martian gullies are similar to
those on earth, but the magnitudes are quite different. Thus,
it is necessary to verify whether the gully detection methods
developed for earth soil erosion analysis are applicable to Mar-
tian gullies detection and it is also desirable to develop gully
detection method dedicated to Martian gullies.
Data
HiRISE
data with an ultra-high resolution (usually 0.25 to 0.5
m/pixel) has shown its great advantage in fine-scaled feature
identification and analysis, and it is used in this research for
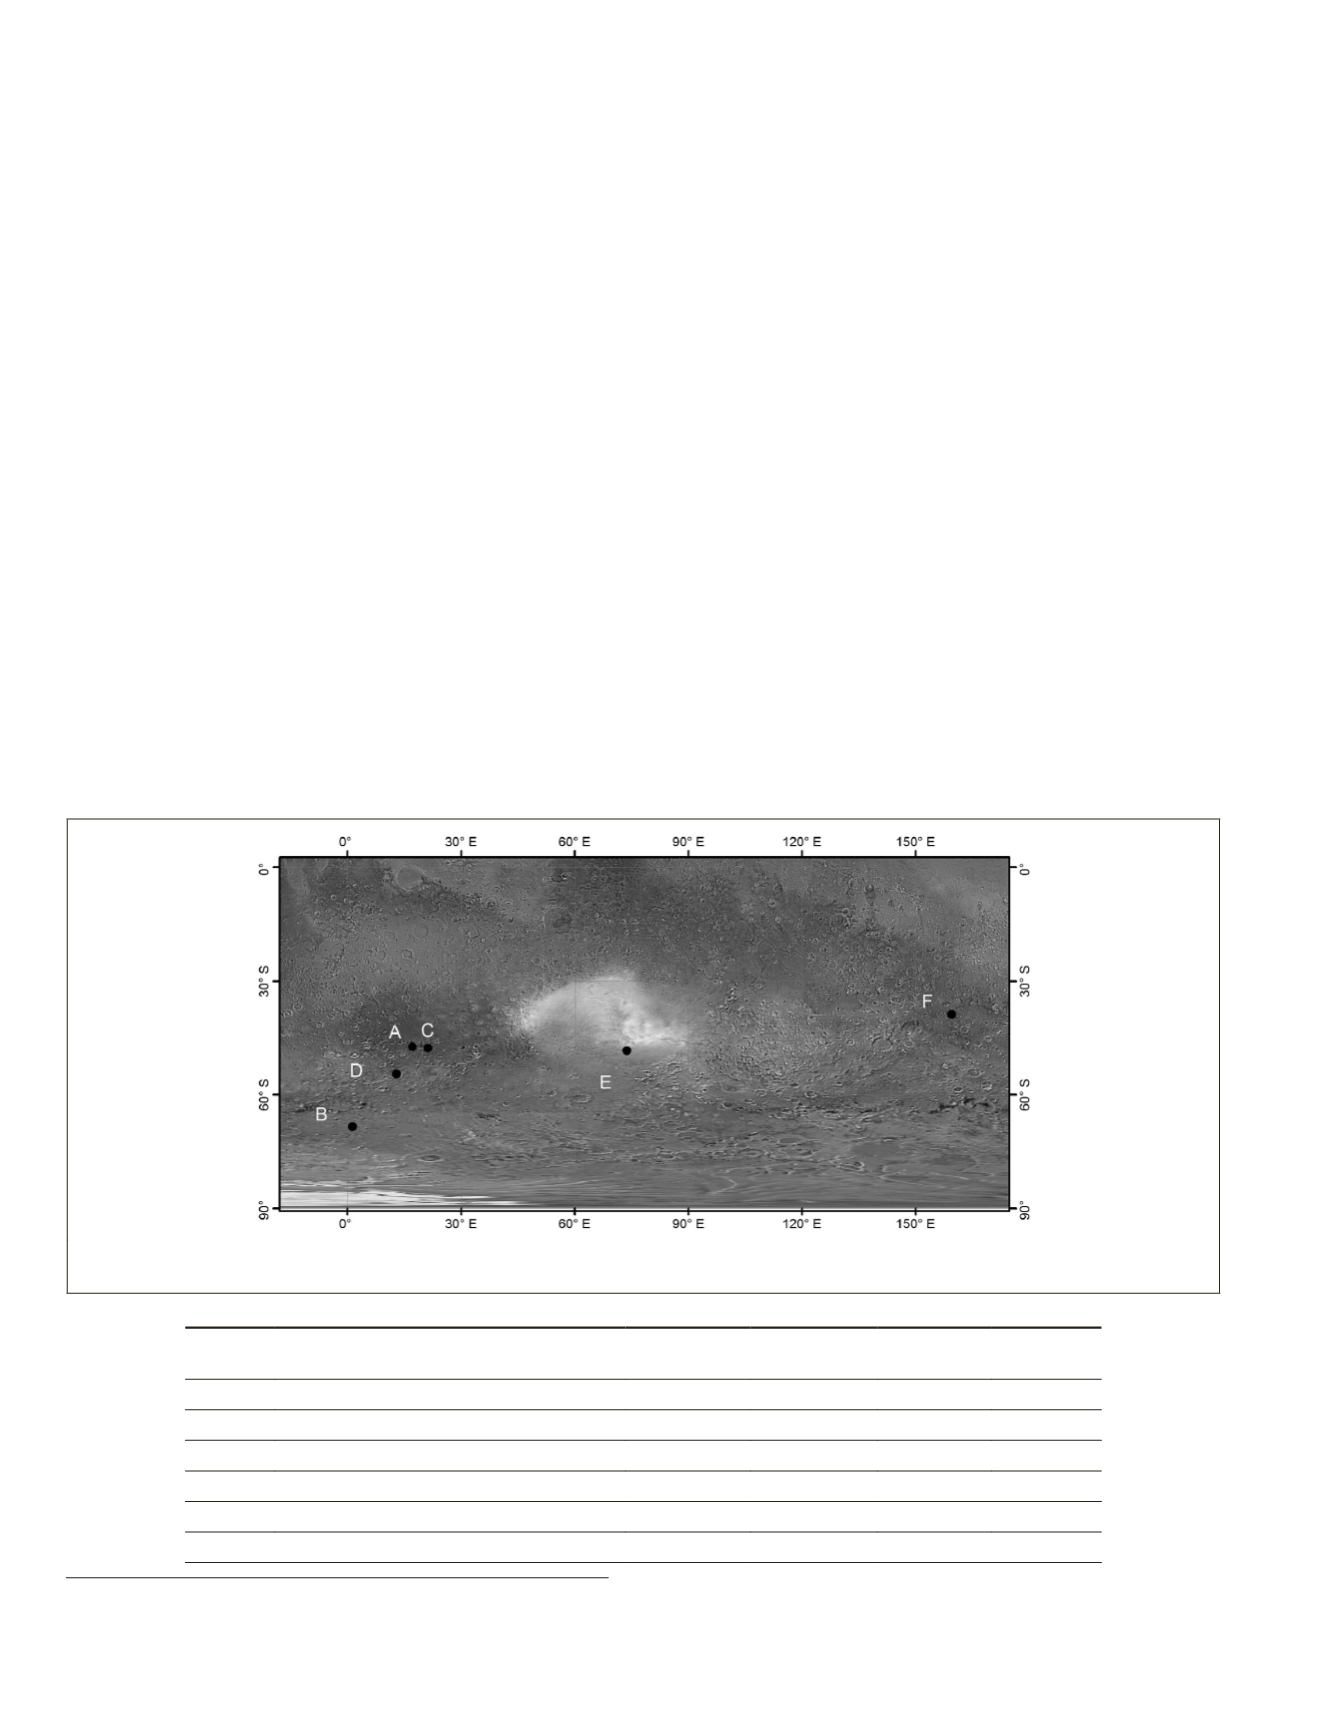
detecting Martian gullies. Six test sites, marked with A through
F, are chosen to test our method, and their locations are shown
in Figure 1. The background image mosaic was obtained from
“Mars Global
GIS DVD
Equidistant Cylindrical (clon0).”
1
The
gullies in Site A and Site F occur on the walls of craters; in Site
C and Site D, the gullies are located on sand dunes; in the rest
of the test sites, gullies are found in other steep slopes. At Sites
A, B, and C, stereo pairs of
HiRISE
images were acquired and the
derived
DTM
s, and orthoimages are also available.
HiRISE
image
data of the six sites and
DTM
of the three sites have been down-
loaded from the
HiRISE
website
). In or-
der to save processing time and discard irrelevant area with no
gullies, images are trimmed to regions of interest. Table 1 lists
the detailed information of the
HiRISE
data used in this research.
An asterisk before a site name denotes there exists related
DTM
at this site. At the sites with
DTM
data, orthoimages are used
instead of original
HiRISE
image.
DTM
data have the same resolu-
tions as the corresponding orthoimages. The reference data
used for detection accuracy assessment is collected by manual
digitization, in which a gully is delineated as a polyline on the
image from its alcove head to the head of fan-shaped apron.
Method
The method we have developed is based on mathematical
morphology techniques that have been widely used in im-
age analysis. In a grayscale image, a gully appears as a small
linear feature, and usually has lower grayscale value than the
1. ftp://pdsimage2.wr.usgs.gov/pub/pigpen/mars/Global_GIS_Mars/
Figure 1. Location map of the six test sites. The background map is a Viking mosaic (available at:
ftp://pdsimage2.wr.usgs.gov/pub/pigpen/mars/Global_GIS_Mars/).
T
able
1. D
etails
of
H
i
RISE D
ata
of
the
S
ix
T
est
S
ites
(A
sterisk
D
enotes
DTM A
vailable
)
Site name
Image product ID
Resolution
(meter)
Image size
(pixel)
Latitude Longitude
*Site A PSP_007110_1325_RED_C_01_ORTHO
1.0
1614×1891 -46.980°
18.794°
*Site B ESP_013097_1115_RED_C_01_ORTHO
2.0
2745×1600 -68.463°
1.310°
*Site C ESP_013083_1325_RED_C_01_ORTHO
1.0
1377×1832 -47.229°
19.479°
Site D
PSP_003748_1250_RED
1.0
1289×1295 -54.582°
12.943°
Site E
ESP_022074_1315_RED
0.25
3536×2139 -48.309°
73.706°
Site F
ESP_028163_1410_RED
1.0
1784×1194 -38.804°
159.488°
914
December 2015
PHOTOGRAMMETRIC ENGINEERING & REMOTE SENSING


