features utilized in the
VS
image interpretation. Second,
due to the large-scale data classification task (with as many
as 568,148 training samples), it is likely that a complicated
classifier with greater computational complexity could not be
utilized, which will be further studied in the future.
Performances when Dealing with the Challenges
Improved
TI-HSI SNR
To evaluate the effectiveness, the no-reference metric Q
(Xiang and Milanfar, 2010) was utilized, which indicates a
better image quality with a larger value. Due to the space limi-
tations, we omit the visual comparison between the original
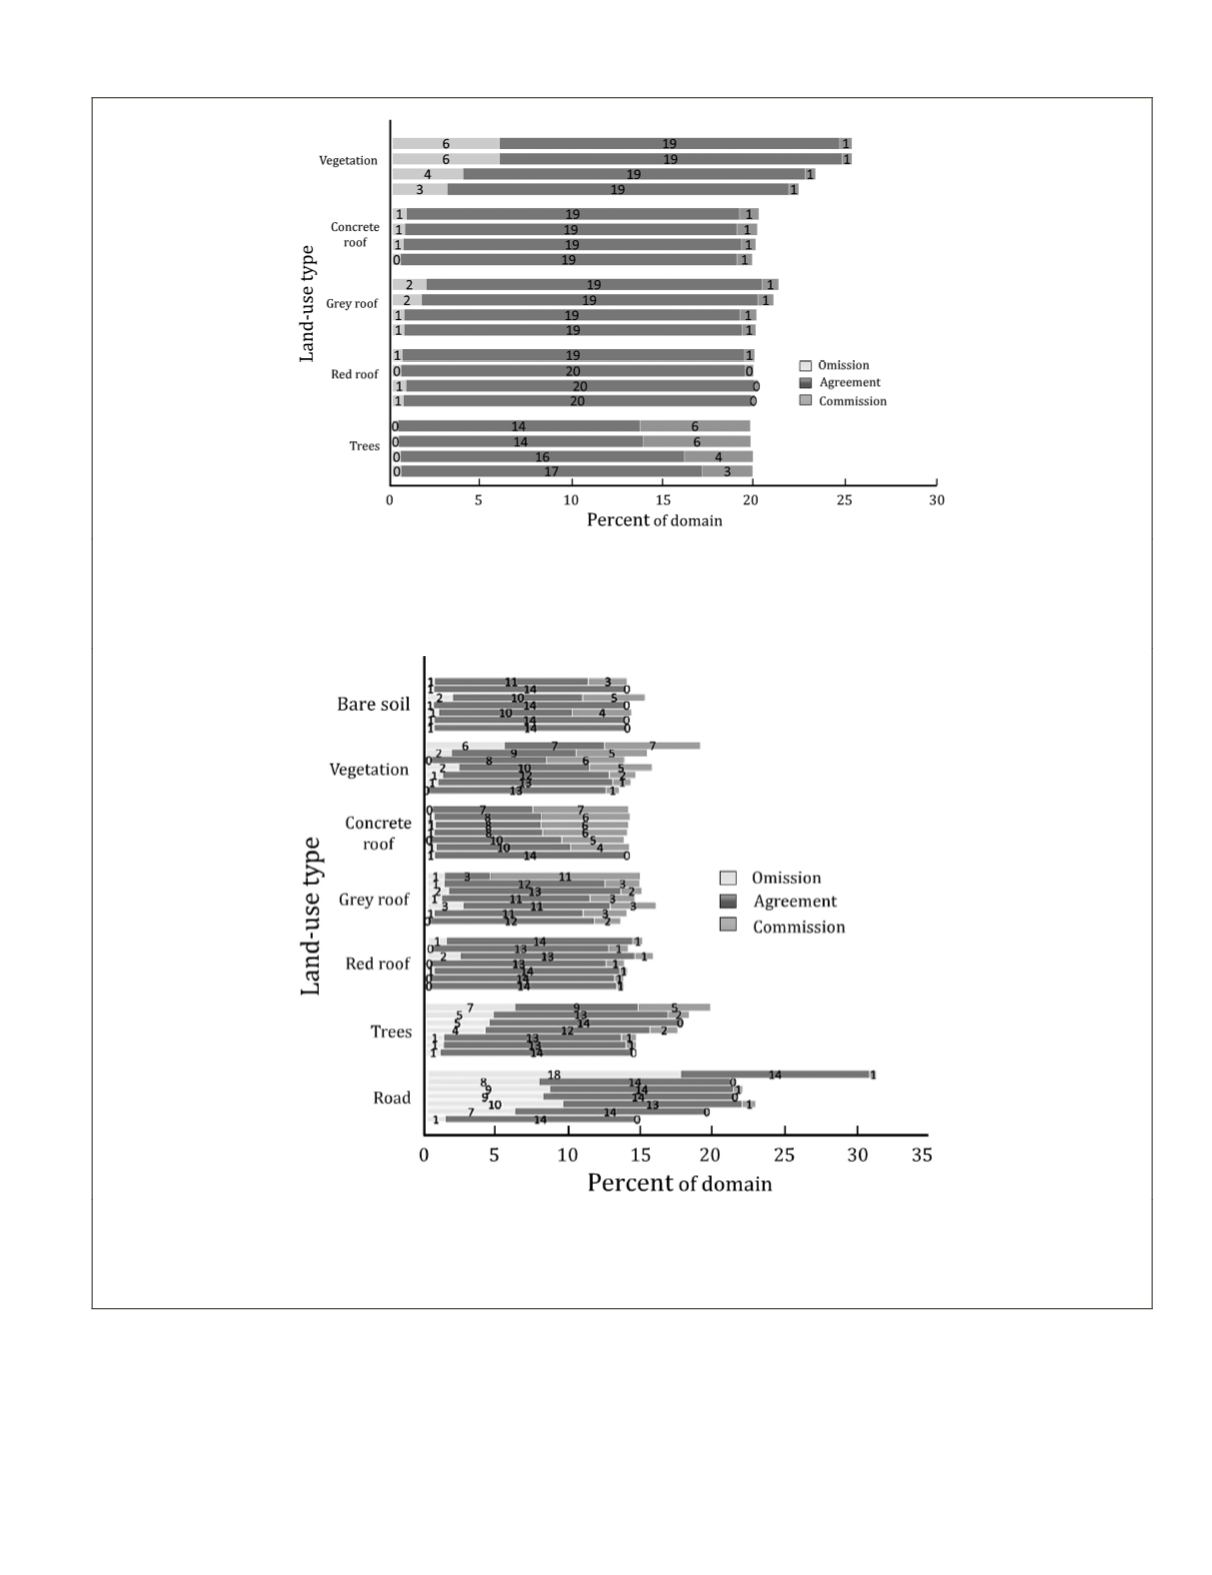
Figure 8. Classification omission, agreement, and commission for each class for the related classifiers with the sub-test set, to display the
performance for inpainting. For each group: the upper bar is for VIS-SF (i.e., the GLCM feature of the VIS), the second bar is associated
with InVIS-SF (i.e., the GLCM feature of the inpainted VIS), the third bar represents VIS-VS, and the bottom bar refers to the InVIS-VS ap-
proach. With regard to these evaluation indices, it can be seen that the classification performance of each category has been improved
by the image gap inpainting.
Figure 9. Classification omission, agreement, and commission for each class for the related classifiers with the global test set, to display
the discriminative ability for each class. The results are shown for each spatial feature related approach for the remaining class classifi-
cation of the study area. For each group, results of the SD, area, moment, DB, GLCM, VS, and the proposed approach are shown in order
from the top to bottom. With regard to these evaluation indices, it can be seen that the VS approach utilizes the complementary spatial
descriptions to effectively improve the classification accuracy.
PHOTOGRAMMETRIC ENGINEERING & REMOTE SENSING
December 2015
909


