image interpolation, as the spectral information of an image,
which is first down-sampled to a certain resolution, and then
interpolated to the same image size as before, hardly changes.
In the following part after the matching step, “
TI-HSI
data”
refers to the denoised and upsampled result after these pre-
processing steps.
VIS Data Inpainting
Due to the inconsistency of the swath width of the
VIS
and
TI-
HSI
data, there are large image gaps within the
VIS
data, which
significantly and negatively affect the extraction of the spatial
features. This is actually an inevitable problem in multi-image
interpretation and feature description. Considering the huge
data dropout, utilizing the simultaneously acquired
TI-HSI
data
is desirable. As mentioned in the last section, energy in the
TI-HSI
data changes in the different strips, which aggravates
the challenge of the inpainting. Fortunately, the
TI-HSI
label
information can be utilized to build the mapping relationship
between the spectral information of the
VIS
data and that of
the thermal infrared measurement in a supervised fashion.
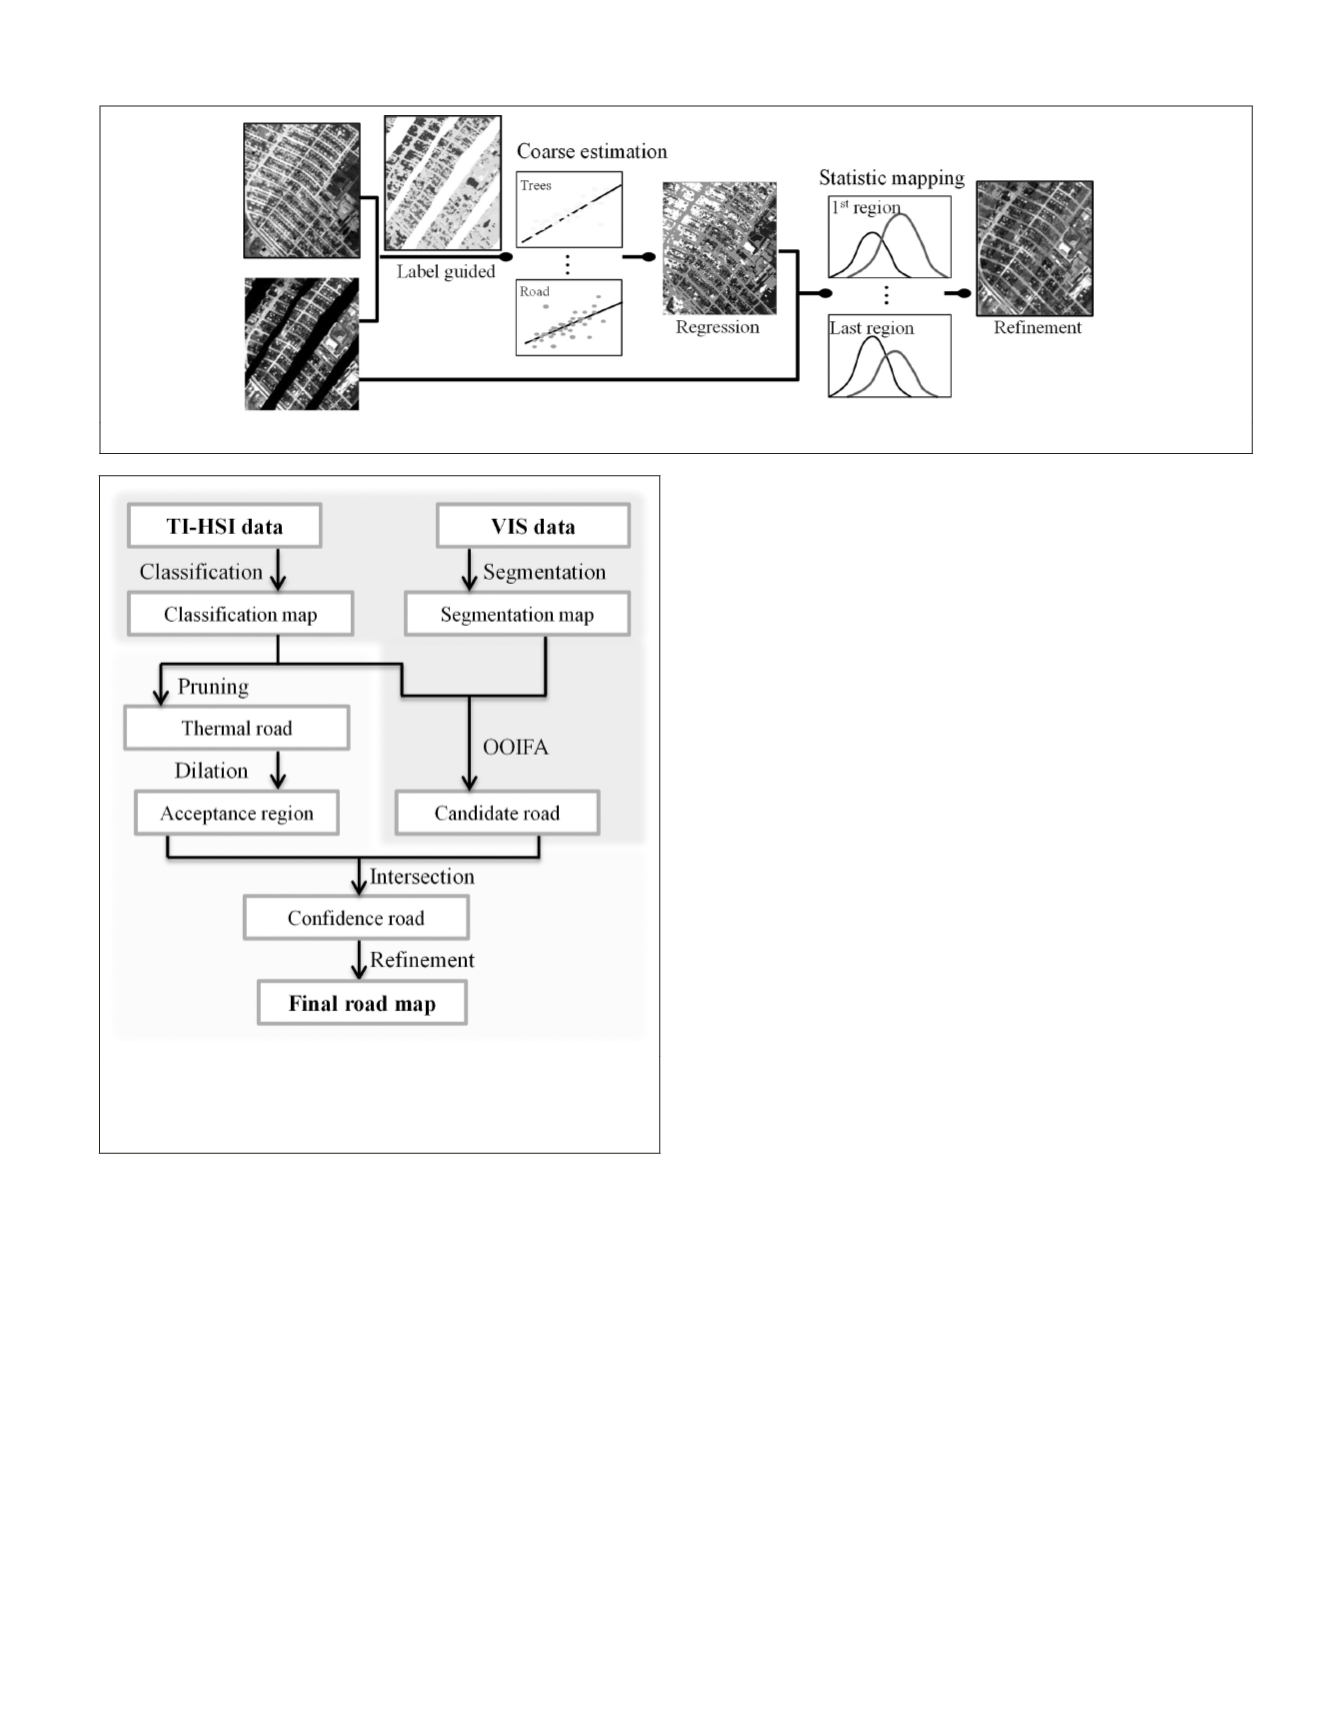
In the proposed approach, the inpainting algorithm in-
cludes two steps. (a) Coarse inpainting per class: as all the
labeled samples are obtained at the same time, the linear
mapping is a function of the two spectral features per class,
without considering the change in temperature. That is, a
fraction of the labeled samples are randomly selected to lin-
early predict the mapping coefficients, and several indepen-
dent trials are taken to correct the unexpected corruption and
inappropriate labels of the
TI-HSI
dataset (see Figure 5). Based
on the estimated regression parameter sets, the linear trans-
formation is then performed. (b) Local luminance adjustment:
the estimated
VIS
band may inherit the luminance change,
which should be adjusted, from the
TI-HSI
dataset. In a local
spatial parcel, it is assumed that pixels in a local spatial part,
belonging to the missing or the known region, should follow
the same distribution. Therefore, mapping the distribution of
the estimated band and that of the given
VIS
band in a known
region, and matching the means of the associated regions, can
alleviate the luminance effects.
Road Extraction
As shown in Figure 6, the flowchart for road extraction
includes two steps: (a) object-oriented image fusion analysis
(
OOIFA
); and (b) road refinement in the confidence region.
Object-Oriented Image Fusion Analysis
For
VHSR
image processing, it is believed that the object-ori-
ented approach is desirable to alleviate the “salt-and-pepper”
misclassification phenomenon caused by the intra-class
spectral variation. Meanwhile, it was also demonstrated in
the previous sub-section that the
TI-HSI
data contain a superior
identification ability for road pixels, and the
VIS
data have a
fine object boundary extraction capability. In view of this, it
is intuitive to combine the superiorities of these two datasets
in an object-oriented fusion manner. Here, we first classify the
TI-HSI
dataset by the use of a linear support vector machine
(SVM) classifier (Boser
et al.
, 1992; Vapnik, 1999), and seg-
ment the
VIS
dataset with the mean-shift algorithm (Coman-
iciu and Meer, 2002; Li
et al.
, 2014). Guided by the clusters of
the segmentation map, a majority voting approach (Huang and
Zhang, 2011) is utilized to achieve the object-oriented fusion
result. In this way, the classification map of the
TI-HSI
dataset
and the segmentation result of the
VIS
dataset are integrated to
produce a candidate road map, as illustrated in Figure 6.
Road Refinement
The aforementioned object-oriented fusion technique can
be affected by the segmentation scale, and it is difficult to
adaptively match all the land objects in an entire complex
scene at one scale. As shown in Figure 7, although most of
the concrete roof pixels in the lower-left part of the sub-region
with its surrounding road pixels are correctly classified in
Figure 5. The flowchart of VIS data inpainting.
Figure 6. The flowchart for road extraction as the first step in the
land-use and land-cover classification framework. The upper part
is associated with OOIFA, while the bottom part is the following
refinement procedure.
PHOTOGRAMMETRIC ENGINEERING & REMOTE SENSING
December 2015
905


