(
FN
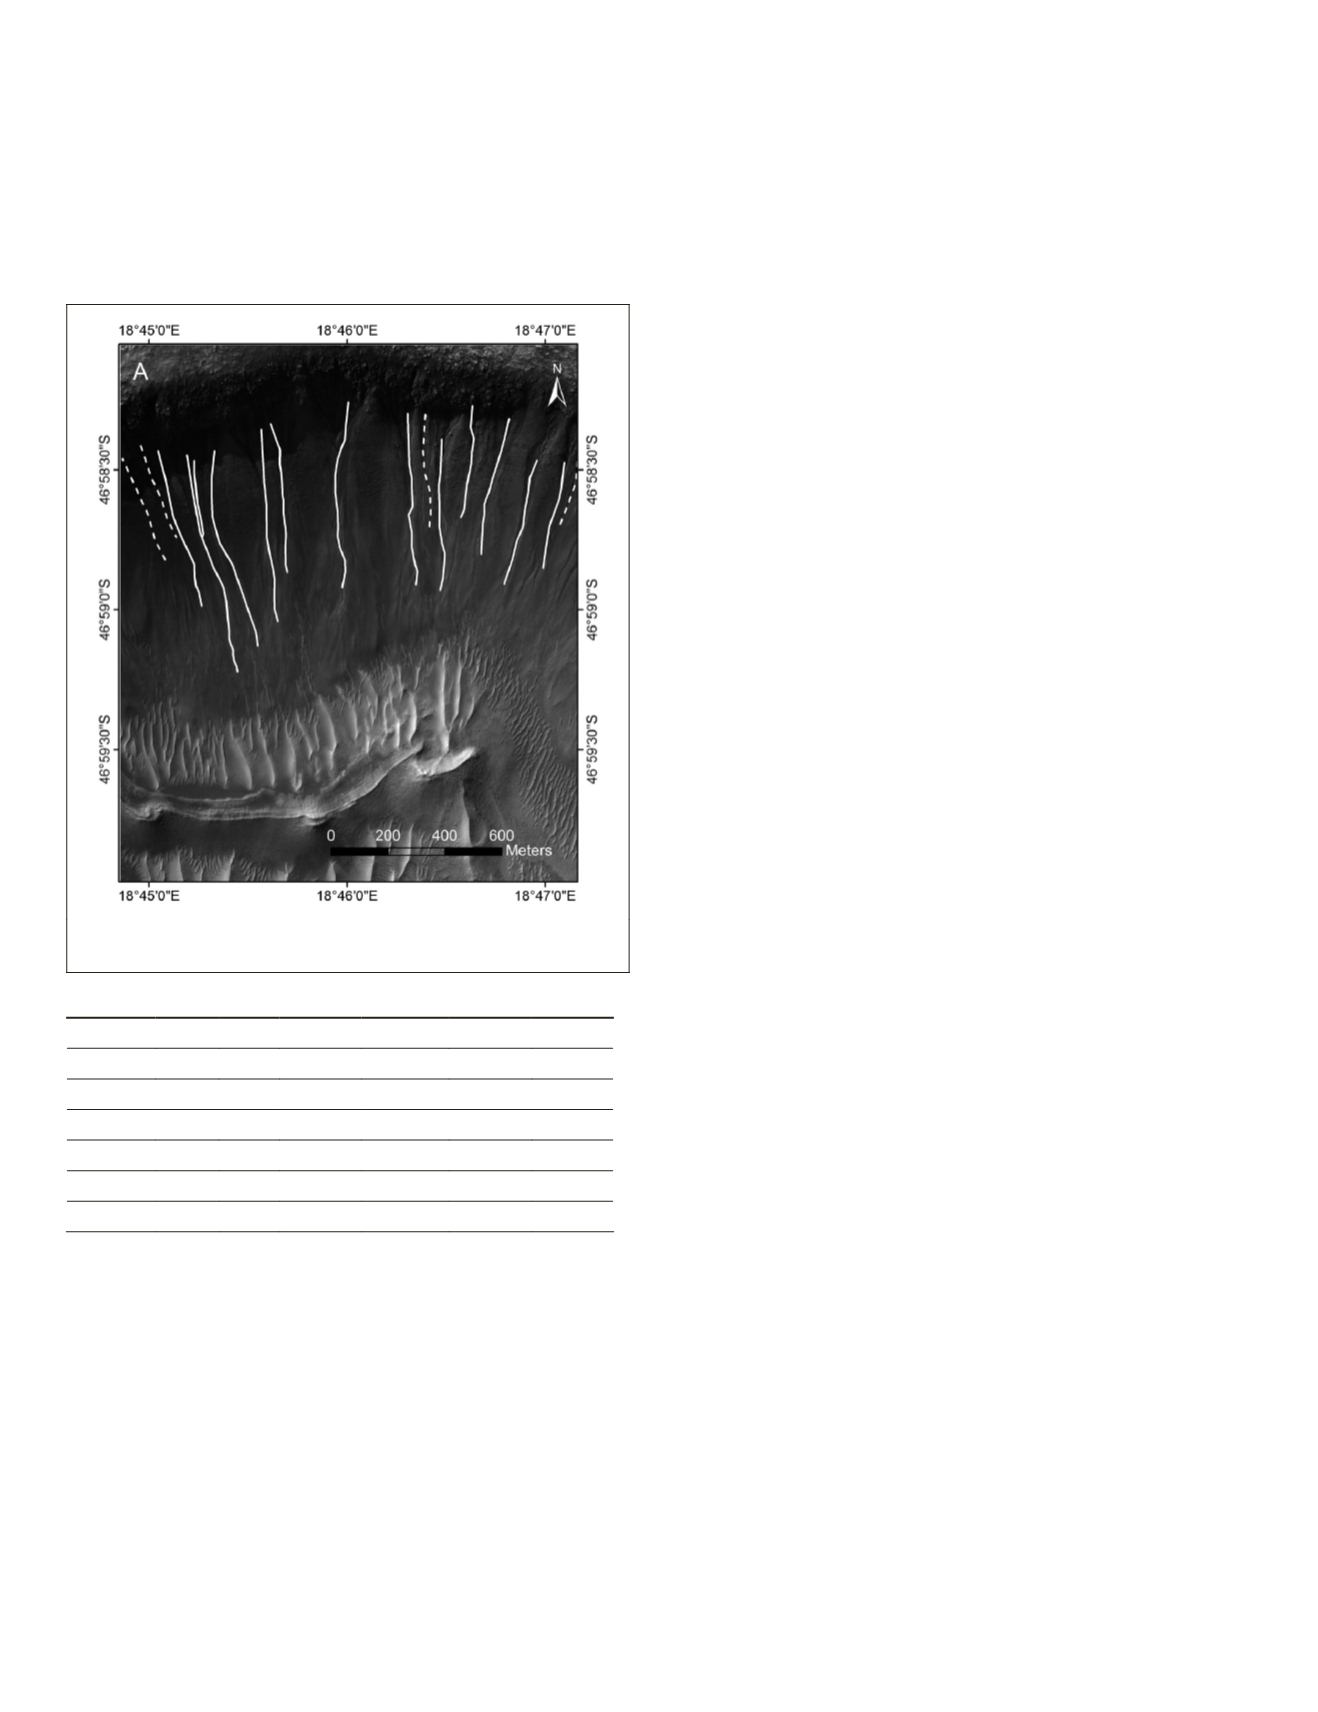
). Figure 7 shows the evaluation result of Site A, with solid
lines representing correct detection (true positive) results and
dashed lines representing false negative results. The evalua-
tion results of Site B through Site F are shown in Plate 1, in
which green lines represent correct detection results, yellow
lines represent false negative results, and read lines represent
false positive results. Table 2 lists the performance quality
factors of the six test sites.
Figure 7. Evaluation results of gully detection of Site A (solid lines:
correct detection results; dashed lines: false negative results).
T
able
2. G
ully
D
etection
Q
uality
F
actors
of
the
S
ix
S
ites
Test site TP FP FN D
B
Q
A 13 0
4
76% 0
76%
B
24 4
3
89% 0.16 77%
C
16 5
1
94% 0.31 73%
D
66 23
18
79% 0.35 62%
E
94 1
10
90% 0.01 90%
F
31 4
6
84% 0.13 76%
From Table 2, it can be seen that factor D is always higher
than 76 percent, indicating most gullies can be correctly
detected by this method. Factor B is always below 0.35,
sometimes lower than 0.16, which means false detection can
be restrained effectively. The values of overall performance
factor Q in majority of the test sites are higher than 73 per-
cent. Site C has the highest detection percentage because the
gullies are well preserved with relatively simple morphology.
Site A has the lowest detection percentage, because the image
characteristics of some gullies are not as distinctive as that
of the successfully detected gullies. Meanwhile, Site A has
the lowest value of factor B because there are no other linear
features around the gullies with length and width similar to
them, and the linear sand ripples are located in a flat area,
which have been removed by relief calculation. The highest
value of factor B appears in Site D, since there is a number of
linear sand ripples in the upper north part, and
DTM
data is
absent for relief calculation; correspondingly Site D has the
lowest value of the overall performance factor Q. Site E has
the highest value of the overall performance factor Q. But
there is a false positive detection in the upper left part of Site
E due to a non-gully dark linear feature.
The gully detection performance is affected by the mor-
phology of the gully and the complexity of the background.
The severely modified gullies with inconspicuous difference
from the background are usually undetected. Other small fea-
tures with similar morphology to gullies tend to increase false
detection. Some wide gullies are also undetected because
we set a small size for the structuring element in Bottom-Hat
transformation to reduce false positive detection.
This is a preliminary study of automated Martian gully
detection from high-resolution images. In the six test sites,
most of the gullies are correctly detected and the false posi-
tive detection is restrained at a low level. Overall, the per-
formance of the mathematical morphology based method is
promising. In principle, the method may be also applied to
other linear target detection, but for Mars high-resolution im-
ages, the method is most suitable to gully detection with the
specified size and length parameters. Further improvement
of the method and more extensive validations will be done in
the future.
Conclusions
This paper presents an automated method for Martian gully
detection from high resolution
HiRISE
images based on math-
ematical morphology techniques. The method integrates a
series of morphological operators, including area opening and
closing, Bottom-Hat transformation and path opening. The
width and length of the gullies to be detected are controlled
by the size of the structuring element for Bottom-Hat trans-
formation and the length parameter for path opening. Relief
calculation is applied as an extra step to remove/reduce false
positive detections, if a
DTM
is available along with the image.
Experimental results at six sites show that the proposed au-
tomated method achieves good performance in Martian gully
detection with accuracy values ranging between 76 percent
and 94 percent. In the future, the method will be further im-
proved to enhance its robustness and applicability by inte-
grating other techniques such as machine learning.
DTM
data
will be better used to calculate the runoff attributions of the
gully such as flow length and watershed area.
References
Balme, M., N. Mangold, D. Baratoux, F. Costard, M. Gosselin, P.
Masson, P. Pinet, and G. Neukum, 2006. Orientation and
distribution of recent gullies in the southern hemisphere of
Mars: Observations from High Resolution Stereo Camera/Mars
Express (HRSC/MEX) and Mars Orbiter Camera/Mars Global
Surveyor (MOC/MGS) data,
Journal of Geophysical Research:
Planets
, 111(E5):E05001.
Bandeira, L., W. Ding, and T. F. Stepinski, 2012. Detection of sub-
kilometer craters in high resolution planetary images using
shape and texture features,
Advances in Space Research
,
49(1):64–74.
Barata, T., E.I. Alves, J. Saraiva, and P. Pina, 2004. Automatic
recognition of impact craters on the surface of Mars,
Image
Analysis and Recognition
(Aurélio Campilho and Mohamed
Kamel, editors), Springer, Berlin, pp. 489–496.
Baruch, A., and S. Filin, 2011. Detection of gullies in roughly
textured terrain using airborne laser scanning data,
ISPRS
Journal of Photogrammetry and Remote Sensing
, 66(5):564–578.
918
December 2015
PHOTOGRAMMETRIC ENGINEERING & REMOTE SENSING


