tree height fusion,
CV
fusion resulted in a significantly dif-
ferent classification accuracy (
p
= 0.016), but
SI
fusion is not
significantly different (
p
= 0.125) from tree height fusion in
classifying ash trees.
With
SVM
classifier, fusion of
CV
and hyperspectral imagery
produced the highest accuracy for ash tree identification and
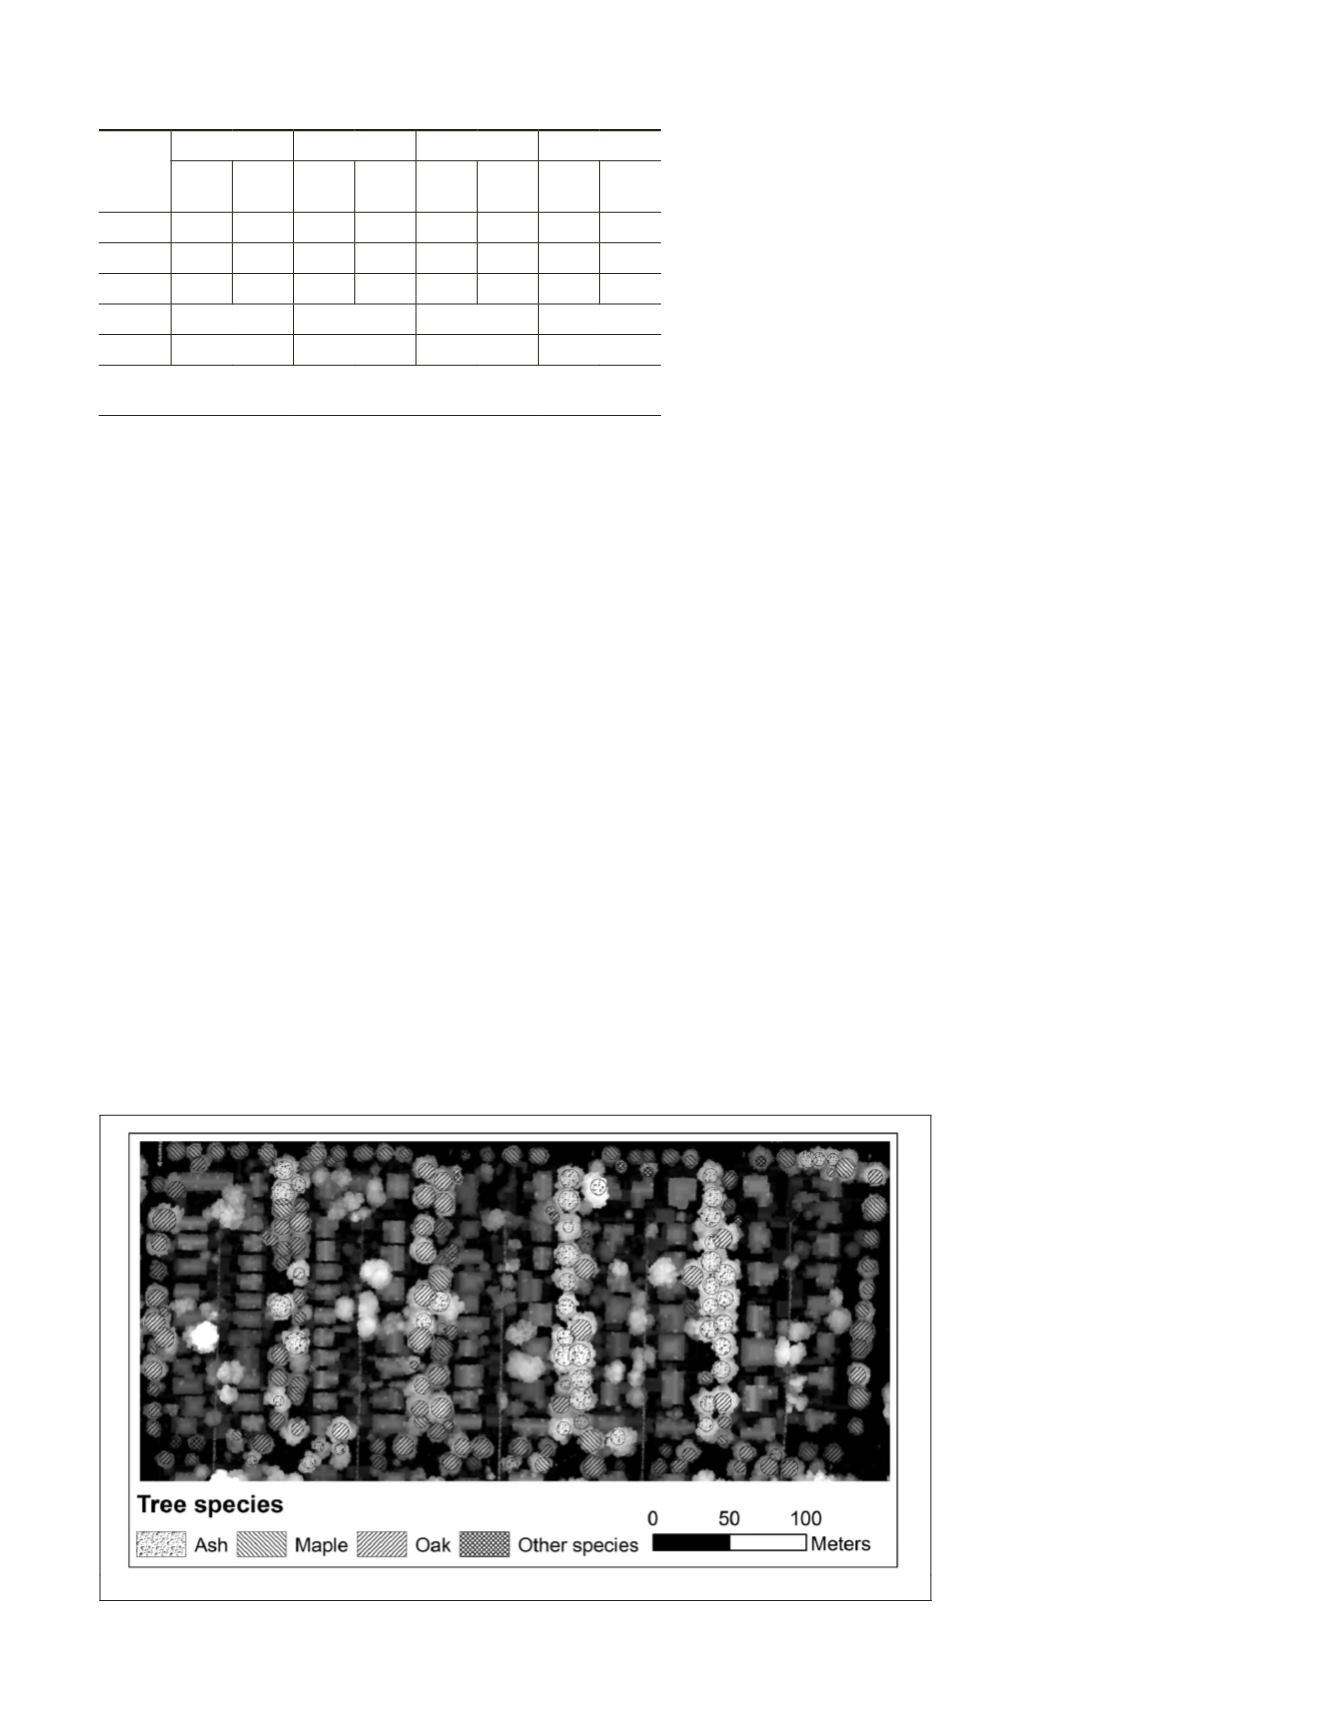
other species classification. The resulted species distribution
of ash, maple, oak, and other species in the study area can be
found in the classification map obtained with the multiple
data fusion (see Figure 5).
Discussion
Both passive and active remote sensing data were used in this
paper for ash tree classification. On the one hand, lidar data
has the potential to minimize noise coming from cloud and
shadows (Deo
et al
., 2017), thus the biophysical parameters
of individual trees can be accurately extracted (Popescu
et al
.,
2003). Because more ash trees rather than non-ash are clus-
tered together in the study area, ash trees have higher
RMSE
than non-ash trees. On the other hand, spectral feature selec-
tion can reduce dimensionality and increase classification
efficiency (Mathur
et al
., 2006), a stepwise spectral discrimi-
nant analysis (
SDA
) was used to select six optimal bands: one
band was from visible region, two bands were from
VNIR
, and
three bands were from
SWIR
.
Regarding the contributions of the three structure features
to ash tree identification from non-ash trees, all the features
derived from lidar data improved the overall accuracies
while
CV
performed best. The high ratio of between-species
and within-species variations, F(1,153) = 48.18,
p
= 0.000,
contributed to ash species classification (
OA
= 83.22 percent,
Kc =0.58). In comparison with the tree height variable, the
shape information provides more explanatory power for ash
tree identification. Zeide and Pfeifer (1991) has pointed out
the same species have geometrically similar crown shapes, so
incorporating tree crown shape information can improve clas-
sification performance (Kulikova
et al
., 2007). In this study,
higher between-species variation to within-species varia-
tion, F (1,153) = 52.22,
p
= 0.000, provided greater contribu-
tion to tree species classification (
OA
= 87.10 percent, Kc =
0.69). Moreover,
CV
calculated the highest ratio of variations
between species to within-species, F (1,153) = 54.31,
p
=
0.000, and produced the highest classification accuracy (
OA
=
89.03 percent, Kc =0.72). In particular, the average
CV
values
for ash and non-ash are 5.33and 8.83, and their standard
deviations are 1.29 and 3.00 respectively. As results, ash
trees were identified from other common deciduous species
with producer’s accuracy of 82.05 percent and user’s accu-
racy 72.19 percent. Various heights and crown radii within
a species group indicate trees have different ages and crown
architectures, which resulted in lower species classification.
In contrast, both
SI
and
CV
produced higher classification
accuracy, which indicate
SI
and
CV
are less affected by tree
ages and crown architectures. In an urban forest, the same
species may exhibit different heights and crown sizes while
different species may have similar values due to different
tree ages. Therefore, the absolute tree heights and crown size
metrics have limited contribution to tree species classification
in a forest with multiple age classes (Jones
et al
., 2010). In
contrast, the shape-related features, such as
SI
and
CV
, can be
considered as invariant features in tree life’s cycle to improve
ash tree identification.
McNemar tests revealed both
SI
fusion and
CV
fusion gener-
ated a significantly better outcome than hyperspectral only at
the 95 percent confidence level with the classification accura-
cies, but tree height fusion did not significantly improved the
classification accuracy. Further, the improvement of
CV
fusion
rather than
SI
fusion is statistically significant in comparison
with tree height fusion. Therefore, more attentions should be
paid to the degree of height dispersion than height metrics
and height trends.
Although structural features provided higher accuracy for
ash tree identification, their contributions to maple, oak, and
other species were limited. The three species groups in the
study area have similar aver-
age heights (12.55 m,13.48 m,
and12.95m), but each of them has
higher degree of dispersion in
height distribution, with standard
deviations of 2.40 m, 3.32 m, and
3.41 m (see Figure 5b). Therefore,
low variation among the three
species comparing to the varia-
tion within a species, F(2, 113)
= 1.23,
p
= 0.296, decreased
classification accuracies. In
contrast, both
SI
and
CV
slightly
improved three species clas-
sification. Average
SIs
for maple,
oak, and other species are 79.85,
80.59, and 78.71, with standard
deviation of 5.36, 5.86, and 7.98,
respectively (see Figure 5d). The
ratio of variation between-species
to within-species is higher than
that derived from tree height
distribution, F(2,113) = 1.63,
p
Figure 5. Classification maps obtained with Hyperspectral imagery and
CV
.
Table 2. Classification accuracies for maple, oak, and other species.
Species
Spectral only Spectral + TH Spectral + SI Spectral + CV
Prod.
(%)
User
(%)
Prod.
(%)
User
(%)
Prod.
(%)
User
(%)
Prod.
(%)
User
(%)
Maple 72.3 77.3 68.1 68.1 72.3 72.3 72.3 79.1
Oak 78.6 57.9 66.1 62.7 71.4 67.8 75.0 66.7
Other 61.5 66.7 15.4 50.0 46.2 66.7 38.5 71.4
OA
66.5
64.5
71.6
72.9
κ
0.52
0.49
0.60
0.61
OA: Overall accuracy (%); PA: Producer’s accuracy (%);
UA: User’s Accuracy (%);
PHOTOGRAMMETRIC ENGINEERING & REMOTE SENSING
August 2018
501


