PHOTOGRAMMETRIC ENGINEERING & REMOTE SENSING
March 2018
123
Relative Horizontal Errors
Relative horizontal error between conjugate features in over-
lapping swaths is often higher in magnitude (sometimes as
much as 10 times) than vertical error. Horizontal error may
reflect an error in the acquisition geometry, and is an im-
portant indicator of the geometric quality of data. Currently,
most methods that quantify horizontal errors in lidar data
(relative or absolute) require some form of explicit feature
extraction or the use of targets. However, feature extraction
may be infeasible at an operational level, for every swath,
when the only purpose is to validate geometric quality.
In this section, a process to summarize (i.e. generate mean,
standard deviation and RMSD) the horizontal errors in the data
is described. The presented process does not measure the rela-
tive displacement of every point in the overlapping region, or
the sampled measurement, but provides a method of directly
es-
timating
the summary statistics (mean, RMSE and Standard
Deviation) of horizontal errors. These errors can be summarized
in a tabular format and used to identify suspect swaths.
Since the datasets are nominally calibrated, the errors be-
tween conjugate features are modeled as relative shifts. Any
rotational error is considered small. This is not an unusual
assumption as geometrically adjusted swaths are expected to
match well. Also, the modeling of errors as shifts is also im-
plicit in describing the quality of other geospatial products.
We generally refer to the mean, standard deviation and root
mean square errors, and estimate accuracy based on an as-
sumption of Gaussian distribution of these errors. Implicitly,
therefore, we model all errors together as a “Mean shift” and
any residual errors are described by the standard deviation.
StepstoestimateRelativeHorizontalErrors:
Operationally,
this process is very simple to implement. The point-to-plane
DQM measurements that are obtained from regions of higher
slope must be identified by a filtering process (say slopes >
10˚). The normal vector components of these measurements
form the ´N´ matrix of equation
N
higher slopes
Δ
X =
DQM, the
corresponding DQM measurements form the right hand side of
the equation.
Δ
X
is the estimate of average horizontal shift in
the data. To solve the equation, one can use any of the libraries
available for solving linear regression/least squares equations.
Mathematical Derivation:
The process of measuring the
point-to-plane DQM also provides us with estimates of the
normal vectors of the planar region, along with an estimate
of curvature. It will be shown in the section below that if the
neighborhood is large enough (this ensures that the planar
fit is stable), and if the curvature is low, the normal vectors,
and the point-to-plane DQM can be combined to estimate the
presence of relative horizontal errors in the data.
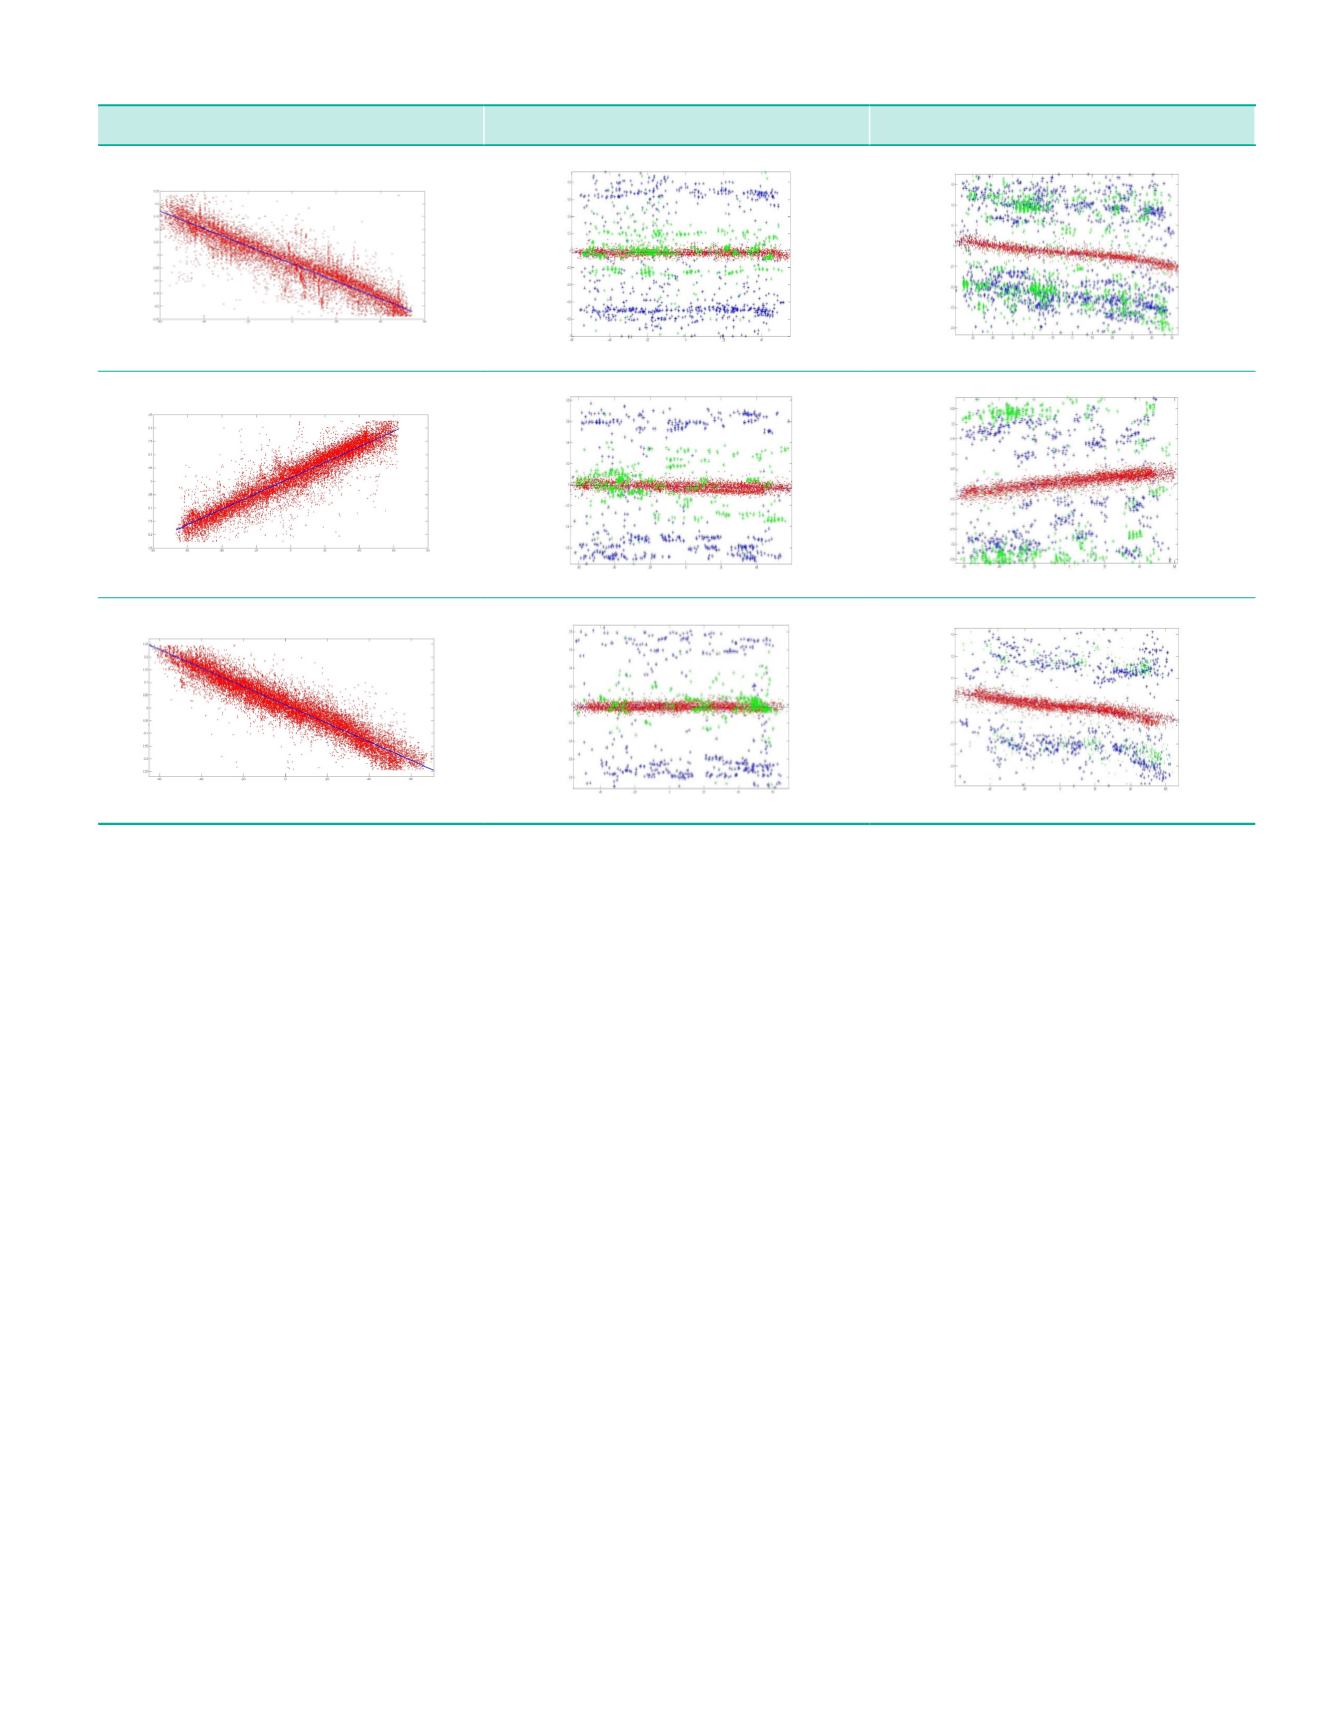
Figure 7: DQM errors as function of distance of points from center of the overlap (each column has different scales). The blue line is a
regression fit on the error as function of distance from center of overlap.
Roll Errors
Pitch Errors
Roll, Pitch and Yaw Errors


