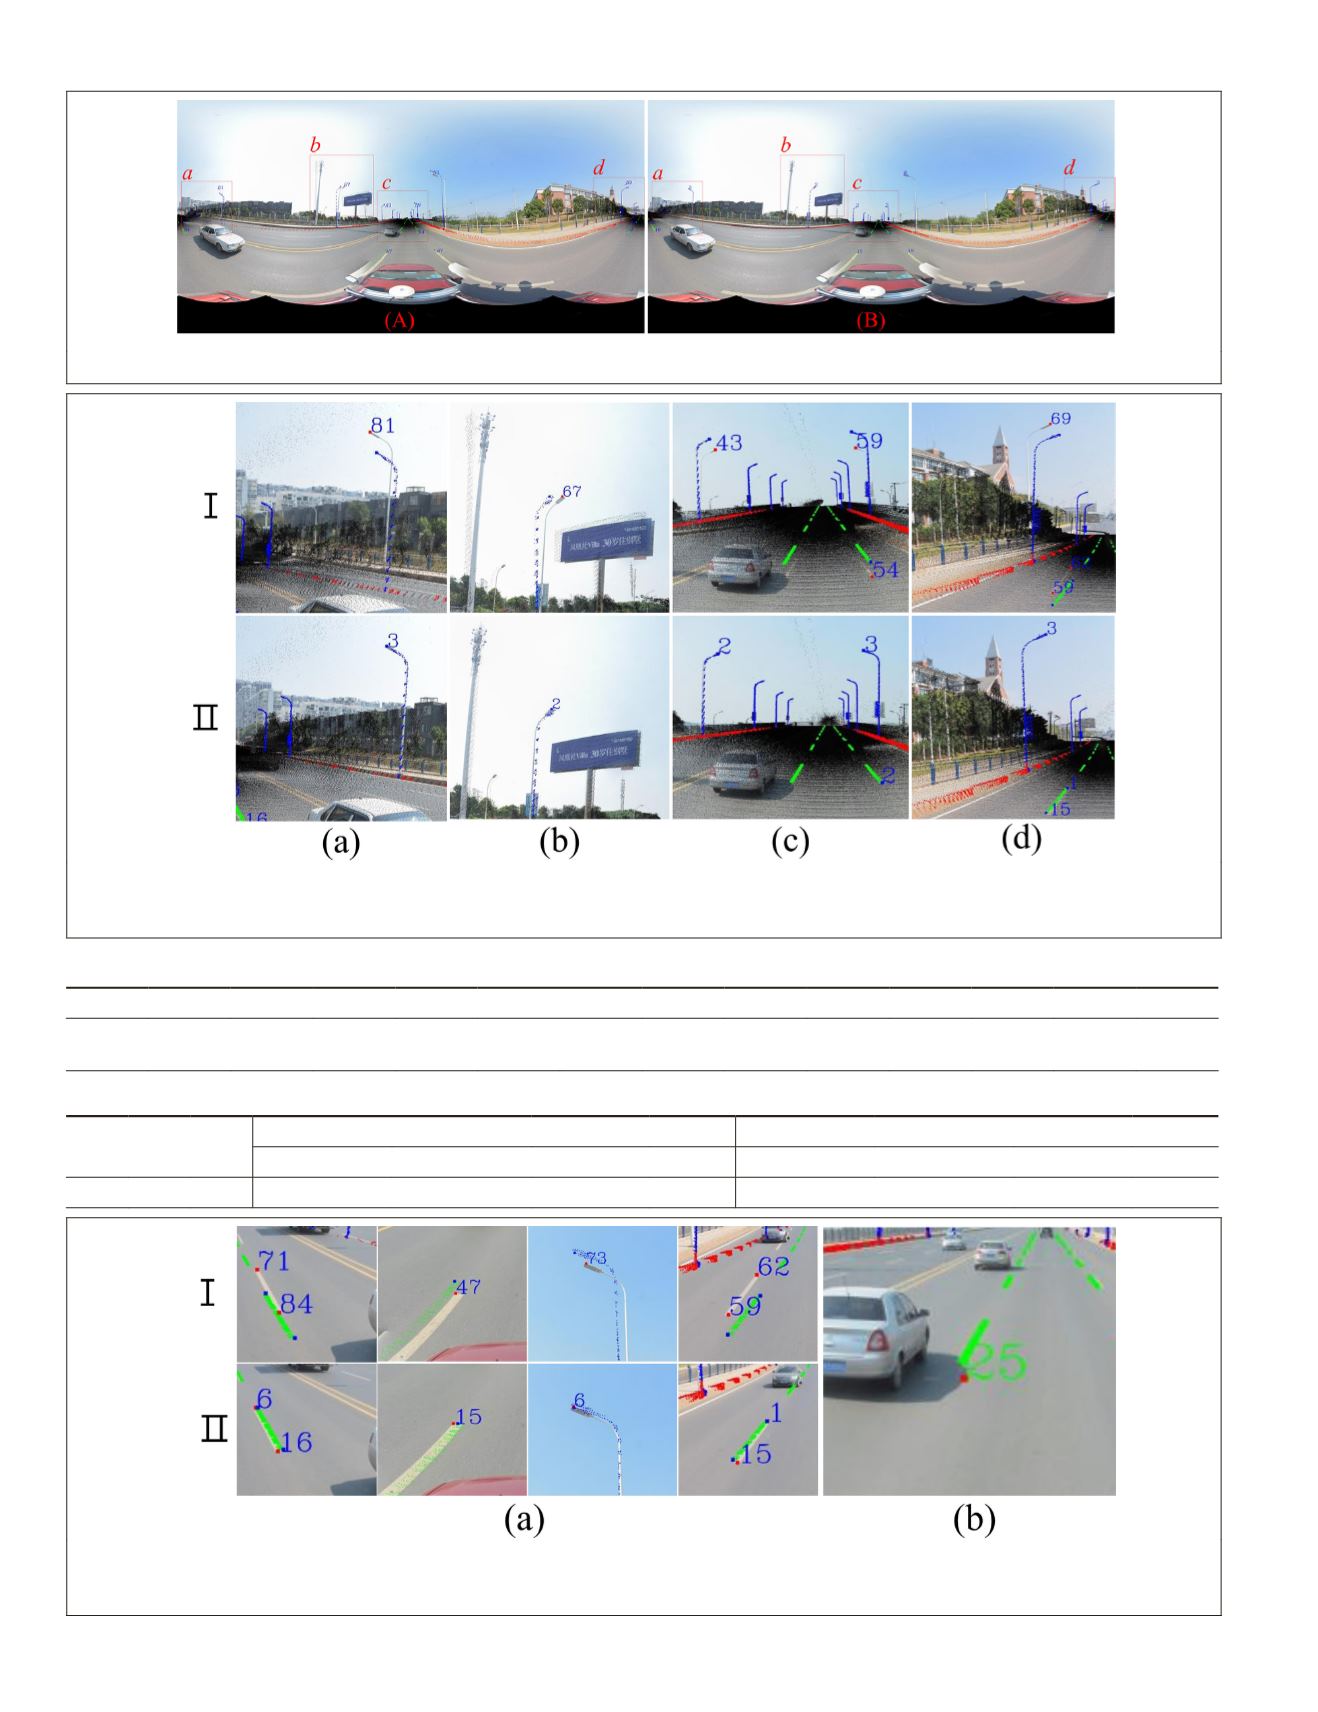
Figure 9. Registration result of the no. 12 panoramic image with the two methods. (A) Method I. (B) Method II.
Figure 10. Local registration effect comparison. The squares are the location of feature points extracted from image and the
projection location of feature points calculated by method I or II, and the number is the distance of corresponding feature
points (unit: pixels). (a) Building and lamps. (b) Lamps and billboard. (c) Lamps and lanes. (d) Lamps and trees.
Table 1. Registration error of each feature point with the two methods (pixels).
Method
δ
1
δ
2
δ
3
δ
δ
δ
δ
δ
δ
δ
10
δ
11
δ
12
δ
13
I
59.91 43.91 73.59 6
1 47.17 62.80 54.33 71.17
II
3.61 2.24 6.32 2
6 15.00 1.00 2.00 6.08
Table 2. Registration accuracy analysis of the panoramic image (pixels).
No.
m n
Method I
Method II
Maximum Minimum Average
δ
Maximum Minimum Average
δ
12 14 13
84.91
43.91
64.78
65.81
19.31
1.00
7.44
9.82
Figure 11. Local images of feature points. (a) Feature point projection with the two methods. (b) The mismatching feature
point. The squares are the error locations extracted from the panoramic image and the projection location of feature points by
method II, and the number is the distance between two squares.
834
November 2019
PHOTOGRAMMETRIC ENGINEERING & REMOTE SENSING


