The
DSM
and orthorectified image resolution is 6 cm while it
is 10 cm for the two other areas.
3D models were generated using the algorithm described
in (Durupt and Taillandier 2006), out of existing building
footprints and aerial
VHR
multiview
DSMs
. The modeling
algorithm simulates possible roof structures with facets
satisfying some geometric constraints. The best configuration
is selected using a scoring system on the extrapolated roofs.
Finally, vertical building façades connect the optimal roof to
the building footprint. These models have a
LoD
-2 level. This
method is adapted to roof types of low complexity and favors
symmetrical models (residential areas). It has been selected
to ensure a varying error rate for the three areas of interest,
especially since models were generated with partly erroneous
cadastral maps. 3235 buildings in total are considered. They
were annotated according to the atomic errors list provided
by our taxonomy. Figure 6.ii reports modeling errors statistics
over the annotated buildings.
Unqualifiable buildings represent a small
3
fraction of
the dataset (<7.5%). Only a small fraction of buildings are
valid
4
: 57 (2.84%) in Elancourt, 55 (7.35%) for Nantes, and
21 (4.39%) in Paris-13.4 Most buildings are affected by the
Building Errors family (>58.16%) and the Facet Errors one
(>75.94%). At the finesse level 3, more differences are noticed
across. Over-segmentation errors are generally well repre-
sented, for all
LoDs
, with at least 38.9% and at most 66.8%.
The same is true for
FIG
(59.8–80%). Otherwise, the presence
ratio is within the percentage interval of [10, 30], except for
topological defects. This negatively impacts the detection of
such rare labels. In general, all errors have the same frequency
across datasets, apart from
FUS
,
BUS
, and
BIT
. They greatly
change from Elancourt (less dense and more heterogeneous)
to Paris and Nantes (compact and uniform patterns).
Experimental Set-Up
Four feature configurations were tested: geometric features
(Geom.) only, geometric and height features (Geom.
∪
Hei.),
geometric and image features (Geom.
∪
Im.), as well as geo-
metric, height, and image features(All.). Each feature modality
generates a 20 dimension vector. The
DSMs
and orthorecti-
fied images used to derive height and image features have
the same spatial resolution as the reconstruction input data.
Labels are extracted from a nonexclusiv
taxonomy. All finesse levels were tested.
is not interesting due to the highly unba
bution. We prefer reporting recall (
Rec
) and precision (
Prec
)
ratios. Recall expresses, from a number of samples of a given
class, the proportion that was rightfully detected as such.
Precision indicates how much samples, amongst the detected
ones, were, in truth, part of the studied class (Powers 2011).
We also summarize these two ratios with their harmonic
mean, the
F
-score.
Feature Analysis
We assess the added value of each modality. Various feature
configurations are studied. They are compared with a base-
line consisting in predicting the errors using only the
RMSE
,
which is the standard measure in most of 3D reconstruction
methods. We conclude the analysis by studying the feature
importance per training zone. All experiments are conducted
performing a 10-fold cross validation to avoid overfitting/un-
derfitting issues.
3. Geometrically inconsistent 3D models were filtered out in a
preprocessing (nadir projection) step. This fraction corresponds only
to the occluded (partially or completely) buildings that could not be
qualified.
4. Valid means the absence of errors for a specified building.
RMSE
Predictive Capacity
We train the classifier on Elancourt with a one-dimensional
feature vector
RMSE
. Mean test results are shown in Table
2 We can conclude that the
RMSE
is not able to detect our
errors. We can distinguish two clusters: high recall and low
precision and overall accuracy (
BOS
,
FOS
, and
FIG
) and low
recall and precision (
BUS
,
BIB
,
BIT
,
FUS
,
FIB
, and
FIT
). The first
group consists of the most numerous errors (Figure 6.ii). This
explains how the classifier assigns to almost all samples the
positive class: we end up with a high ratio of false positives
(false alarms) and hence a high recall ratio but coupled with
a weak precision and overall accuracy. The inverse happens
with the rest of the errors as we obtain a high percentage of
false negative.
Feature Ablation Study
We tested the different feature configurations, at finesse level
3 and in all urban zones. Mean precision and recall test
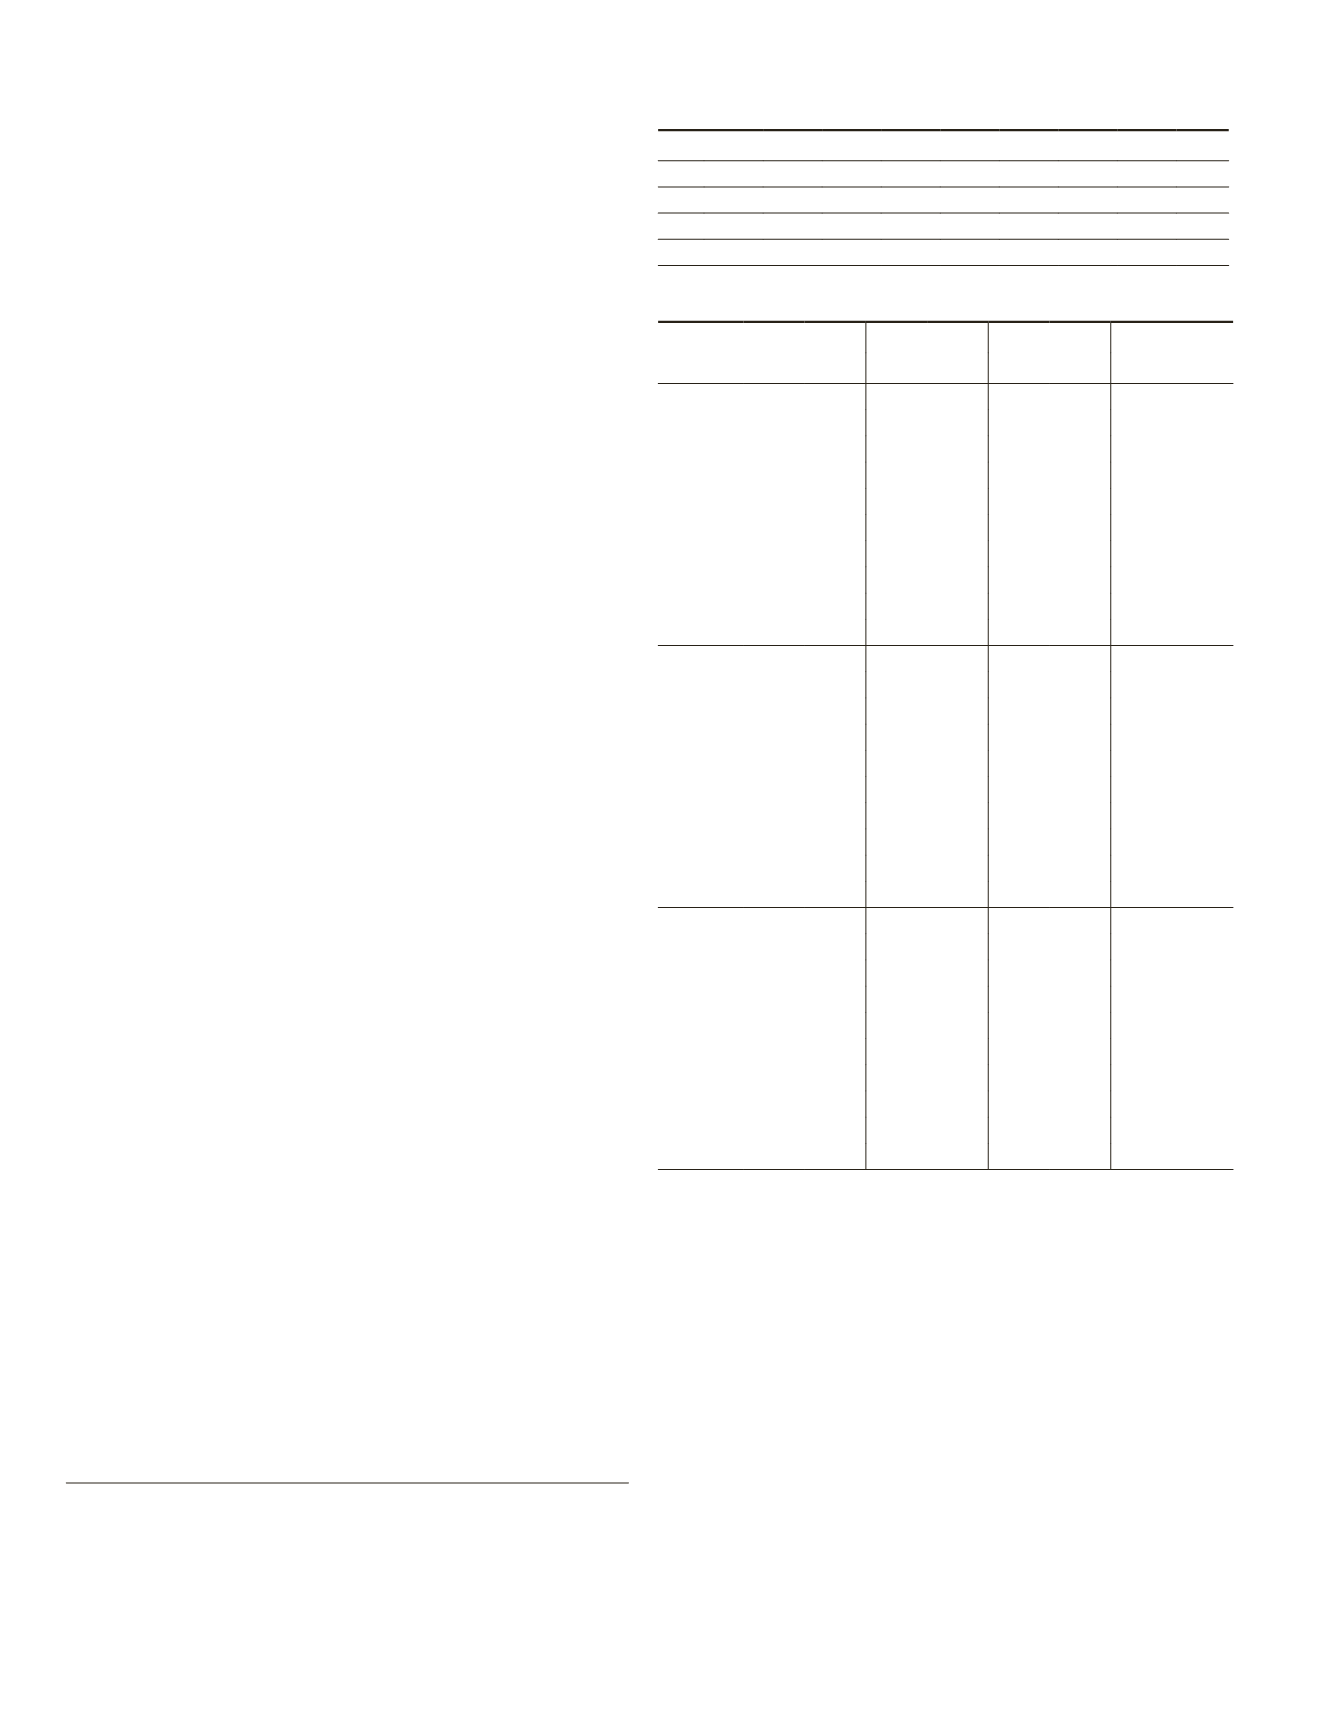
Table 2. Finesse 3 experiment results using
RMSE
on Elancourt.
BOS BUS BIB BIT FOS FUS FIB FIT FIG
Rec
99.55 0.21 0
0 98.68 0.63 0
0 98.15
Prec
68.78 33.33
0 66.60 0.25
0 61.15
F
score
81.35 0.42 0
0 79.52 1.24 0
0 75.36
Acc
68.46 75.65 89.57 94.66 66.36 83.62 88.24 98.36 60.86
Table 3. Feature ablation study preformed on the three areas at
finesse level 3.
Geom.
Geom.
∪
Hei. Geom.
∪
Hei.
All.
Rec Prec Rec Prec Rec Prec Rec Prec
Elancourt
BOS
93.96
76.15 91.43
77.76
91.51 76.08 90.83 76.14
BUS 32.98
76.47 41.86
75.57 40.38 71.00 39.32 71.81
BIB 12.32 67.57 12.81
68.42
16.26 67.35
16.75
68.0
BIT
25.25
92.59 20.20 90.91 20.20
95.24
11.11 91.67
FOS 98.91 99.07 98.91
99.30 98.99
98.84 98.91 98.84
FUS
1.90
54.55 0.63
66.67
1.61 50 1.27
66.67
FIB
9.17
87.5 0
8.30 82.61 7.42
100
FIT 6.67
100 8.73
95.24 3.33
100
3.33
100
FIG
80.54
73.14 80.45
72.62
78.69 72.12 79.02 71.82
Nantes
BOS
38.14
61.67 36.43 60.23 36.77
62.21
34.71 60.48
BUS 7.35 62.5 7.35 55.56
29.41 66.67
26.47 64.29
BIB
0
0
1.01 50.0 1.01 50.0
BIT 1.77 22.22
3.54
44.44 0
0 2.65
50.0
FOS
98.54 98.13 98.54 98.13
98.33 97.92 98.12 97.91
FUS 27.62 55.24
27.62 59.18
24.76 54.74 23.33 53.85
FIB 37.80 62.0 36.59
63.16 49.39
60.90 46.39 60.90
FIT
0
0
0
0
FIG 86.32 78.09
86.77
78.02 84.53
78.71
83.86 78.08
Paris-13
BOS 45.54 65.25 46.53 68.61 50.0 68.24 46.53
70.15
BUS 6.35 66.67 7.94 71.43
22.22 77.78
7.94 62.5
BIB
0
0
0
0
0
0
1.32 50.0 0
0
97.19 97.19
97.59 98.38
97.19 97.19
84.36 74.12 85.09 74.52 84.36 74.12
FIB 53.47 62.10 51.39 61.67
53.47 63.11
52.78 61.79
FIT
0
0
0
0
FIG 97.65 84.62
98.96
84.79 97.65 84.62 98.96 84.79
872
December 2019
PHOTOGRAMMETRIC ENGINEERING & REMOTE SENSING


