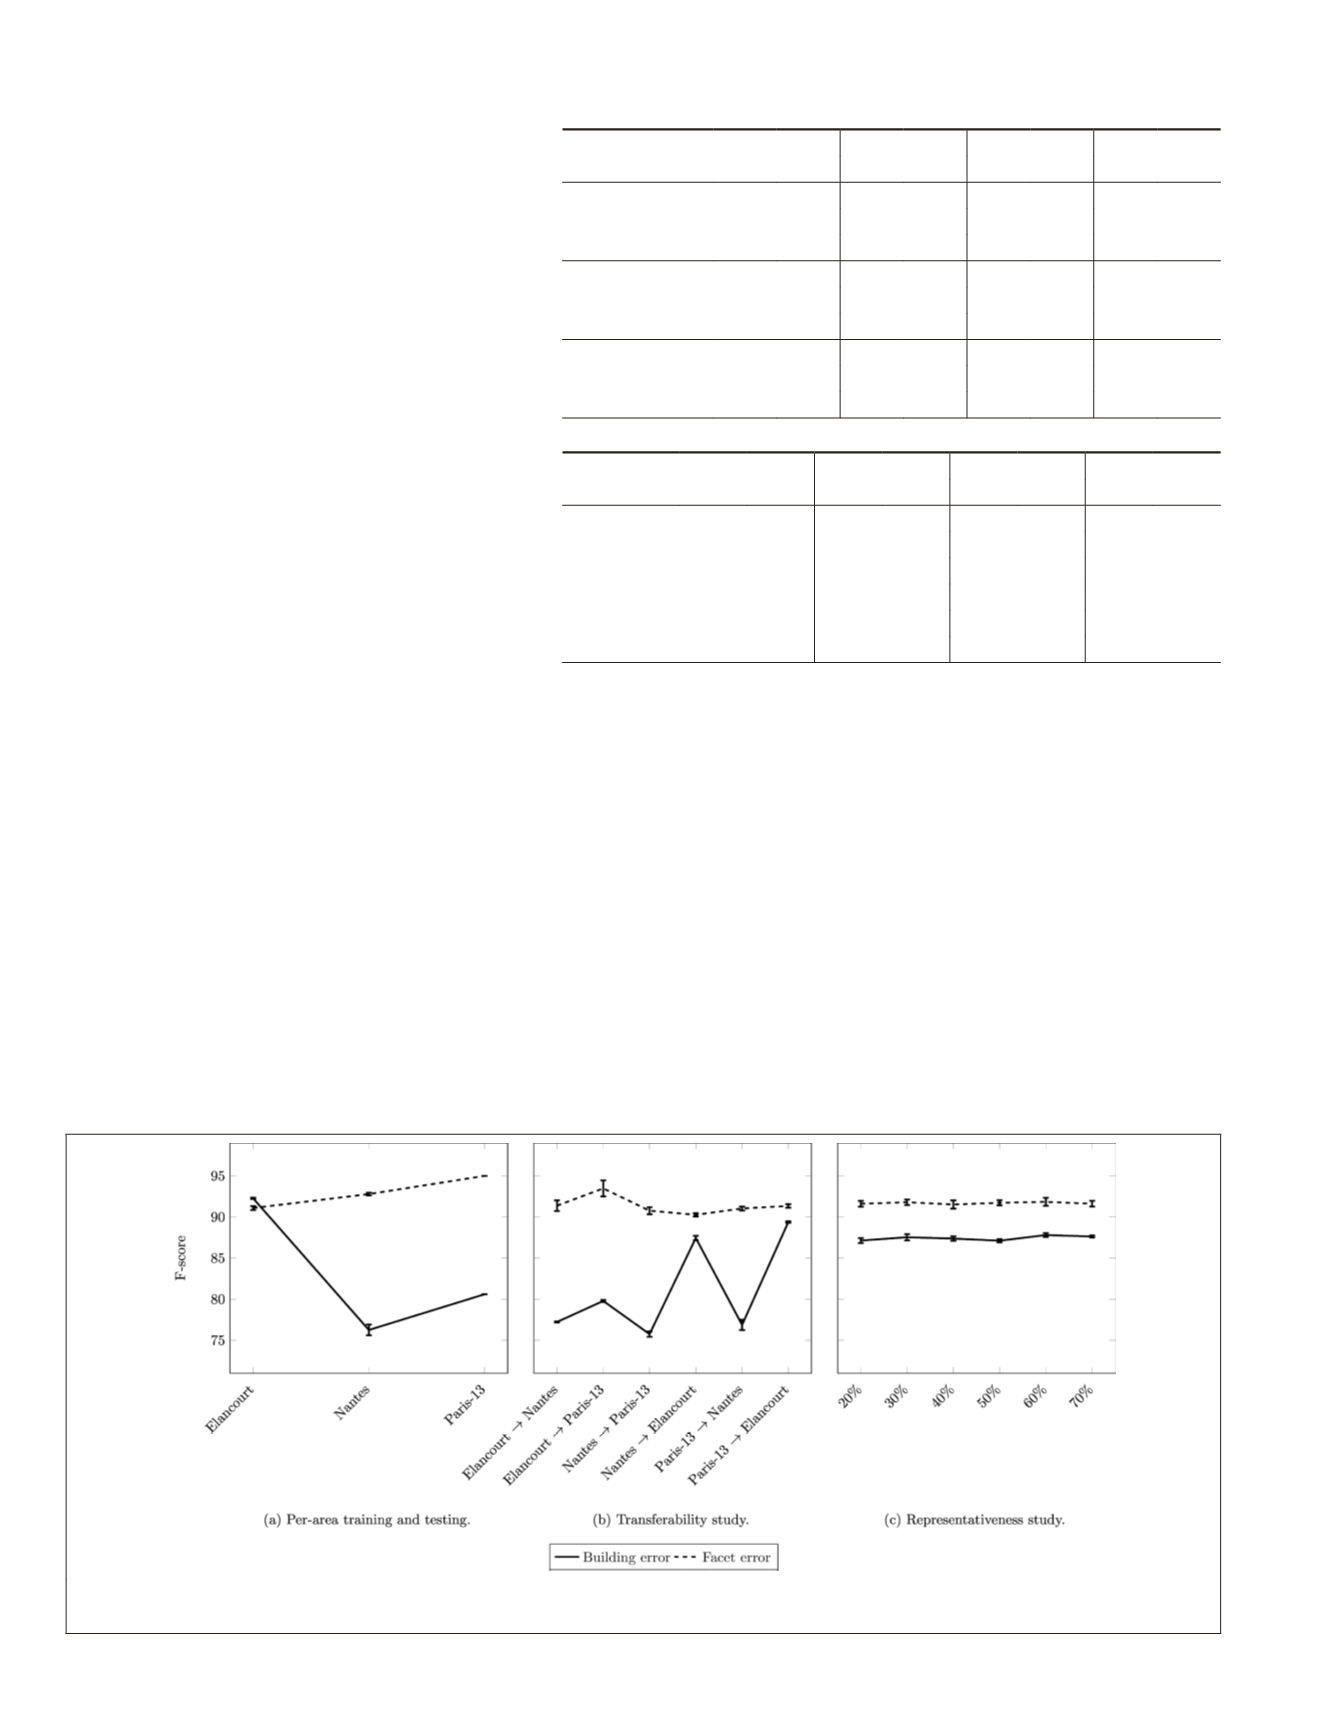
results dramatically. This is perfectly illustrated by
the low variance in Figure 14a for the three areas of
interest. These results are in line with the conclu-
sions at the finesse level 3. In the higher finesse
level, only
BUS
, from all atomic errors, was highly
impacted by a change in the feature configuration.
This may explain the observed low variability. We
also note the prevalence of
FOS
errors (between 60%
and 85%) and
FIG
(between 70% and 95%) in the
Facet Errors family. This added to the fact that they
are, in a large capacity, easily detected individu-
ally (>90%, in
F
-score, for the first and 80% for the
second, see Figure 8b) helps understanding why the
F
-score reaches at least 90% for this family (Figure
14a). As with finesse level 3 experiments, Facet Er-
rors yields higher prediction scores than on Build-
ing Errors. Indeed, we can see a smaller discrepancy
between
F
-scores on different scenes for Facet Er-
rors (below 5%) than for Building Errors (15%).
The transferability study (Figure 14b) compares
the
F
-scores with the ablation study provided in
Figure 14a. Out of all 12 possible comparisons, only
two exhibit a decrease in error discrimination. Both
affect the Building Errors family when trained on
Nantes. Facet Errors, on the other hand, confirms,
its transferability and stability (less than 5% of
discrepancy between the two extremal values). For
this reason, we skip the generalization study, all together, at
this section.
The representativeness study conducted for the finesse
level 2 results in the
F
-scores that are illustrated in Figure
14c. Family detection scores are very stable across all differ-
ent tested split ratios. Moreover, in contrast to atomic errors
results (cf. Figure 13),
F
-scores do not vary by more than 1%
in mean and standard deviation. This proves that at finesse
level 2, error family prediction is evened out independent of
different split ratios, as opposed to higher order errors. Again,
it benefits from the higher heterogeneity of the training set
with multiple areas.
Detection of Erroneous Models
Now, we work at finesse level 1, first on feature ablation.
Since valid samples are very rare in our
that it will be very difficult to detect the
quence, in Table 6, we choose to report
ings instead of computing the precision score in percentage.
At this level, even more that the error family semantic
degree, feature configurations have virtually no impact on
test results: Elancourt was the only exception when im-
age features are added to geometric ones. Furthermore, we
confirm expectations as, at most, only 1 out of 57 (resp
.
0 out
of 55 and 3 out of 21) valid instances are detected for Elan-
court (resp
.
Nantes and Paris-13). As a consequence, we do
not report the rest of previously conducted experiments for
this finesse level. Indeed, it is senseless to compare detec-
tion transferability, generalization or representativeness if we
hardly detect them at all on the same training scene.
Conclusion
A learning framework was proposed to semantically evalu-
odels of buildings. For that purpose,
ally organized into a novel flexible
andle the large diversity of urban envi-
requirements stemming from end-users
Figure 14. F-score mean and standard deviation for the feature ablation study outcomes per zone for finesse level 2. (a)
corresponds to the ablation study, (b) to the transferability experiments, and (c) to the representativeness setting.
Table 5. Feature ablation study on the three datasets for the finesse = 2 case.
Geom.
Geom.
∪
Hei. Geom.
∪
Im.
All.
Rec Prec Rec Prec Rec Prec Rec Prec
Elancourt
Building Errors 99.76
85.96
99.82 85.88 99.88 85.57
100
85.55
Facet Errors
91.79
89.79
92.65 89.40 93.21 89.45
93.46
89.16
Nantes
Building Errors 85.98 67.27
87.59
67.79 85.75 68.32 86.90
69.23
Facet Errors
91.20 94.01 91.37
94.36
91.20 94.35
91.73
94.21
Paris-13
Building Errors 97.36 68.76 97.36 68.76 97.36 68.76 97.36 68.76
Facet Errors
99.03 91.26 99.03 91.26 99.03 91.26 99.03 91.26
Table 6. Test results expressed in percentage for the finesse = 1 case.
Geom.
Geom.
∪
Hei.
Geom.
∪
Im.
All.
Rec Valid Rec Valid Rec Valid Rec Valid
Elancourt
Erroneous 99.95 1/57 99.95 1/57 99.95 1/57 99.95 1/57
Nantes
Erroneous 99.84 0/55 99.84 0/55 100 0/55 100 0/55
Paris-13
Erroneous 99.77 3/21 99.77 3/21 99.77 3/21 99.77 3/21
876
December 2019
PHOTOGRAMMETRIC ENGINEERING & REMOTE SENSING


