results are reported in Table 3.
F
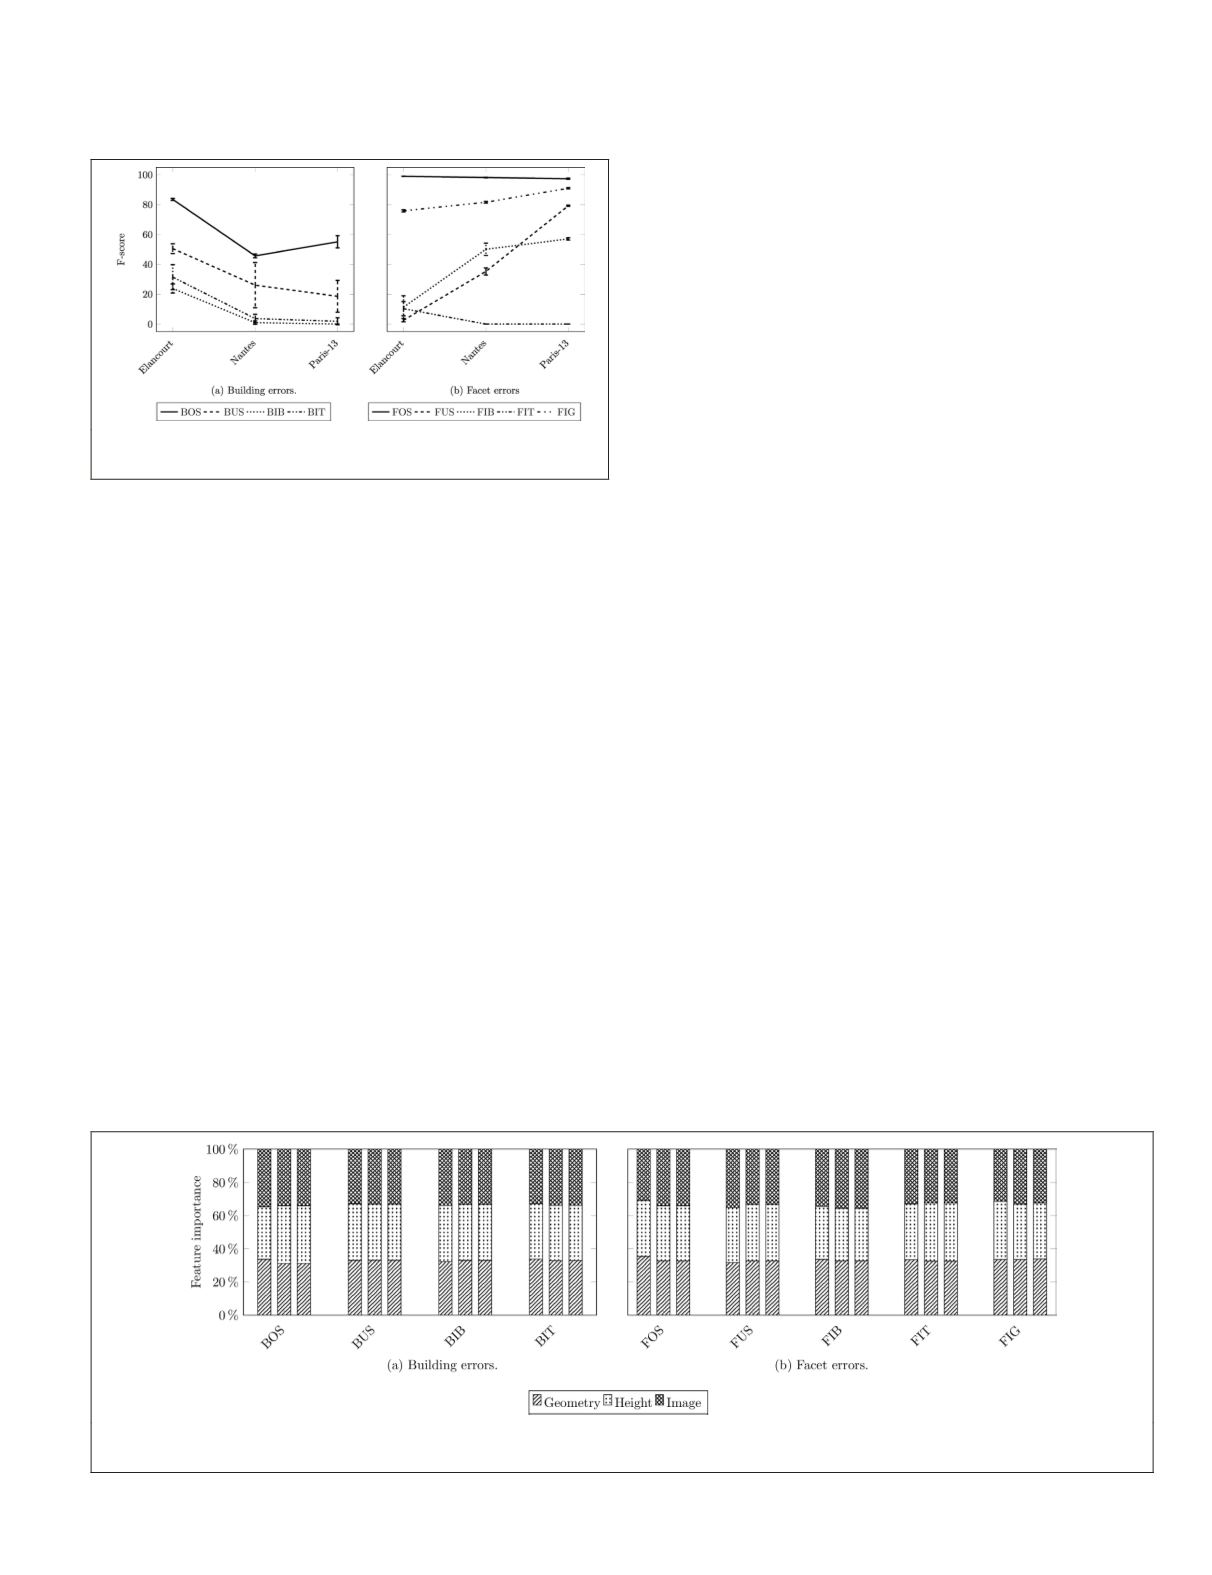
-scores are averaged across all
feature configurations and represented in Figure 8.
Figure 8. Mean F-score and standard deviation for the
feature ablation study.
We can first conclude that geometric features alone are
generally sufficient. It is the best alternative for topological
error detection as shown for
BOS
,
FOS
,
FUS
,
FIT
, and
BIT
in
Table 3. This is confirmed also by the low variance observed
in Figure 8a. An exception is noticed with
BUS
in Elancourt,
where height-based features allow an increase of around 9%
in recall without, practically, any loss in precision. Similar
behavior is noticed for Nantes and Paris-13 with image-based
features (+20% in recall). The first case can be explained
by the discrepancy in height that can be observed between
under-segmented buildings. The second is made clear by the
difference in roof colors, in dense uniform settings (Figure
3.i.a). This helps identifying different instances of buildings.
Figure 8 shows all Building Errors family labels are better
detected for Elancourt. It is also the case of
FOS
and
FIT
. A cer-
tain monotony can be noticed, at the exception of
BOS
. Better
results are obtained for Paris-13 than for Nantes, while having
around half the number of models to train on. This means that
BOS
cannot be easily learnt in Nantes. It is coherent with the
fact that the dataset represents a part of the dense downtown of
the city. The same monotony is observed, this time in reverse,
with the rest of Facet Errors defects. Pari
with less training samples. For geometric
Nantes is comparable to Paris-13, but, wi
worse. This may result from the highly h
of this dataset that encompasses high tower buildings with a
densely populated city district. Finally, well represented errors
are more easily detected than the less frequent ones, especially
the rare ones like
FIT
in Nantes and Paris-13.
Feature Importance
Random forest classifiers can easily infer feature importance
at training time. These were here computed and aggregated by
modality in all urban scenes (Figure 9).
At first, we observe how much individual attributes are
important before being gathered. For geometric features, all
attributes are equally important. However, concerning image-
and height-based features, only a few are relevant (higher
feature importance ratio). Indeed, these few attributes cor-
respond to the highest and lowest values of the histograms.
As described earlier, image and height features consist of a
histogram of distances between the model and the real mea-
sured signals: vector cosine similarity, for the first, and the
L
2
norm for the last. It is clear that the presence of errors would
result in saturating the high values in the histogram, while an
absence of defects would imply a big number of low values.
This intuitively explains the observed phenomenon.
The second time, we notice that no modality is more
important than the others, contrarily to what was observed
in Table 3. In fact, for most atomic errors, test results using
geometric features are comparable to those obtained with
more modalities. However, during training, all modalities are
relevant (
≈
1/3 in Figure 9). This explains why all configura-
tions are kept for subsequent analysis.
Scalability Analysis
It is established that the scene composition can affect greatly
model defect detection. This fact motivates studying train-
ing the classifier and testing prediction on different scenes.
The goal is to prove the resilience of the prediction to unseen
urban scenes. As the annotation process require a lot of effort,
this trait is crucial to guarantee the scalability of this method.
Different configurations are possible (Figure 10). In a first
experiment, we train on one urban scene and test on another
one (transferability of the classifier model). In a second con-
figuration, the classifier is trained on two scenes and tested on
the last one: the goal is to investigate generalization. The last
experiment targets the representativeness of a single 3-area
dataset by trying multiple train-test splits.
We will see how Building Errors depend on the training
acet Errors. The latter will prove to be
generalizable than the first one. We will
y modalities play a role in error predic-
ures will demonstrate to be the most
valuable compared to height-based ones. Eventually, we will
review each atomic error prediction sensitivity provided the
training set.
Figure 9. Modality importance computed by stacking single feature importance retrieved from the Random Forest classifier.
The first (resp. second and third) column represents Elancourt (resp. Nantes and Paris-13).
PHOTOGRAMMETRIC ENGINEERING & REMOTE SENSING
December 2019
873


