the Facet Errors. Only 8 out of 27 projectivity errors are worse
than training on the same test area.
As mentioned earlier, additional modalities play an impor-
tant role in prediction accuracy. We start with image-based
attributes. In some cases, they were pivotal in obtaining better
results for geometric errors (
FIB
,
BIB
), as well as for topological
ones (
FUS
,
FIT
). These features have a significant coherence
power when trained over Elancourt (
FIB
and
FUS
), and projects
very well to other scenes (
FIB
,
FUS
,
BIB
, and
FIT
), (Table 4). On
the other hand, as expected, geometric features alone are best
for topological errors, when trained on dense areas, especially
BIT
(Table 4). Finally, although sticking out for
FIG
in a minor
capacity (cf. Table 4), height-based features proved to be less
transferable. In fact, adding height-based features leads, in
most cases, to a small decrease in accuracy (= 2%) for atomic
errors. All these previous findings further justify why we did
not leave out any modality, as they are more frequently criti-
cal for transferability than in the ablation study (Table 3).
An analysis can also be drawn for atomic errors with re-
spect to the best training scene. We can see that for
BOS
, train-
ing on a dense urban scene like Nantes, is the best solution,
as for topology errors (
FIT
and
BIT
). Paris-13 represents also a
dense downtown scene but with even more diverse building
types. This is instrumental to achieve transferability for
BUS
and
BIB
. Conversely, Elancourt offers more heterogeneity on
the
LoD
-2 level. As a consequence, it is the best training zone
for
FUS
,
FIB
, and
FIG
. Finally, as one can obviously suspect,
FOS
learning is evenly transferable, as it is well detected when
training on any scene.
Generalization Study
We try to find out how omitting one urban zone from the
training dataset affects the test results on that same area. An-
other way to look at it is, from an operational point of view,
to find out how much learning on a union of many urban
scenes is helpful when testing on an unseen one. We also seek
to confirm the outcome of the transferability experiments.
Experiments that merge all zones except
Z
i
∪
"
i
≠
j
Z
j
for train-
ing and test on
Z
i
are noted by the couple (
∪
"
i
≠
j
Z
j
,
Z
i
) or by
∪
"
i
≠
j
Z
j
Z
i
. There are three possibilities: Elancourt
∪
Nantes
Paris-13, Paris-13
∪
Nantes
Elancourt, and Paris-13
∪
Elancourt
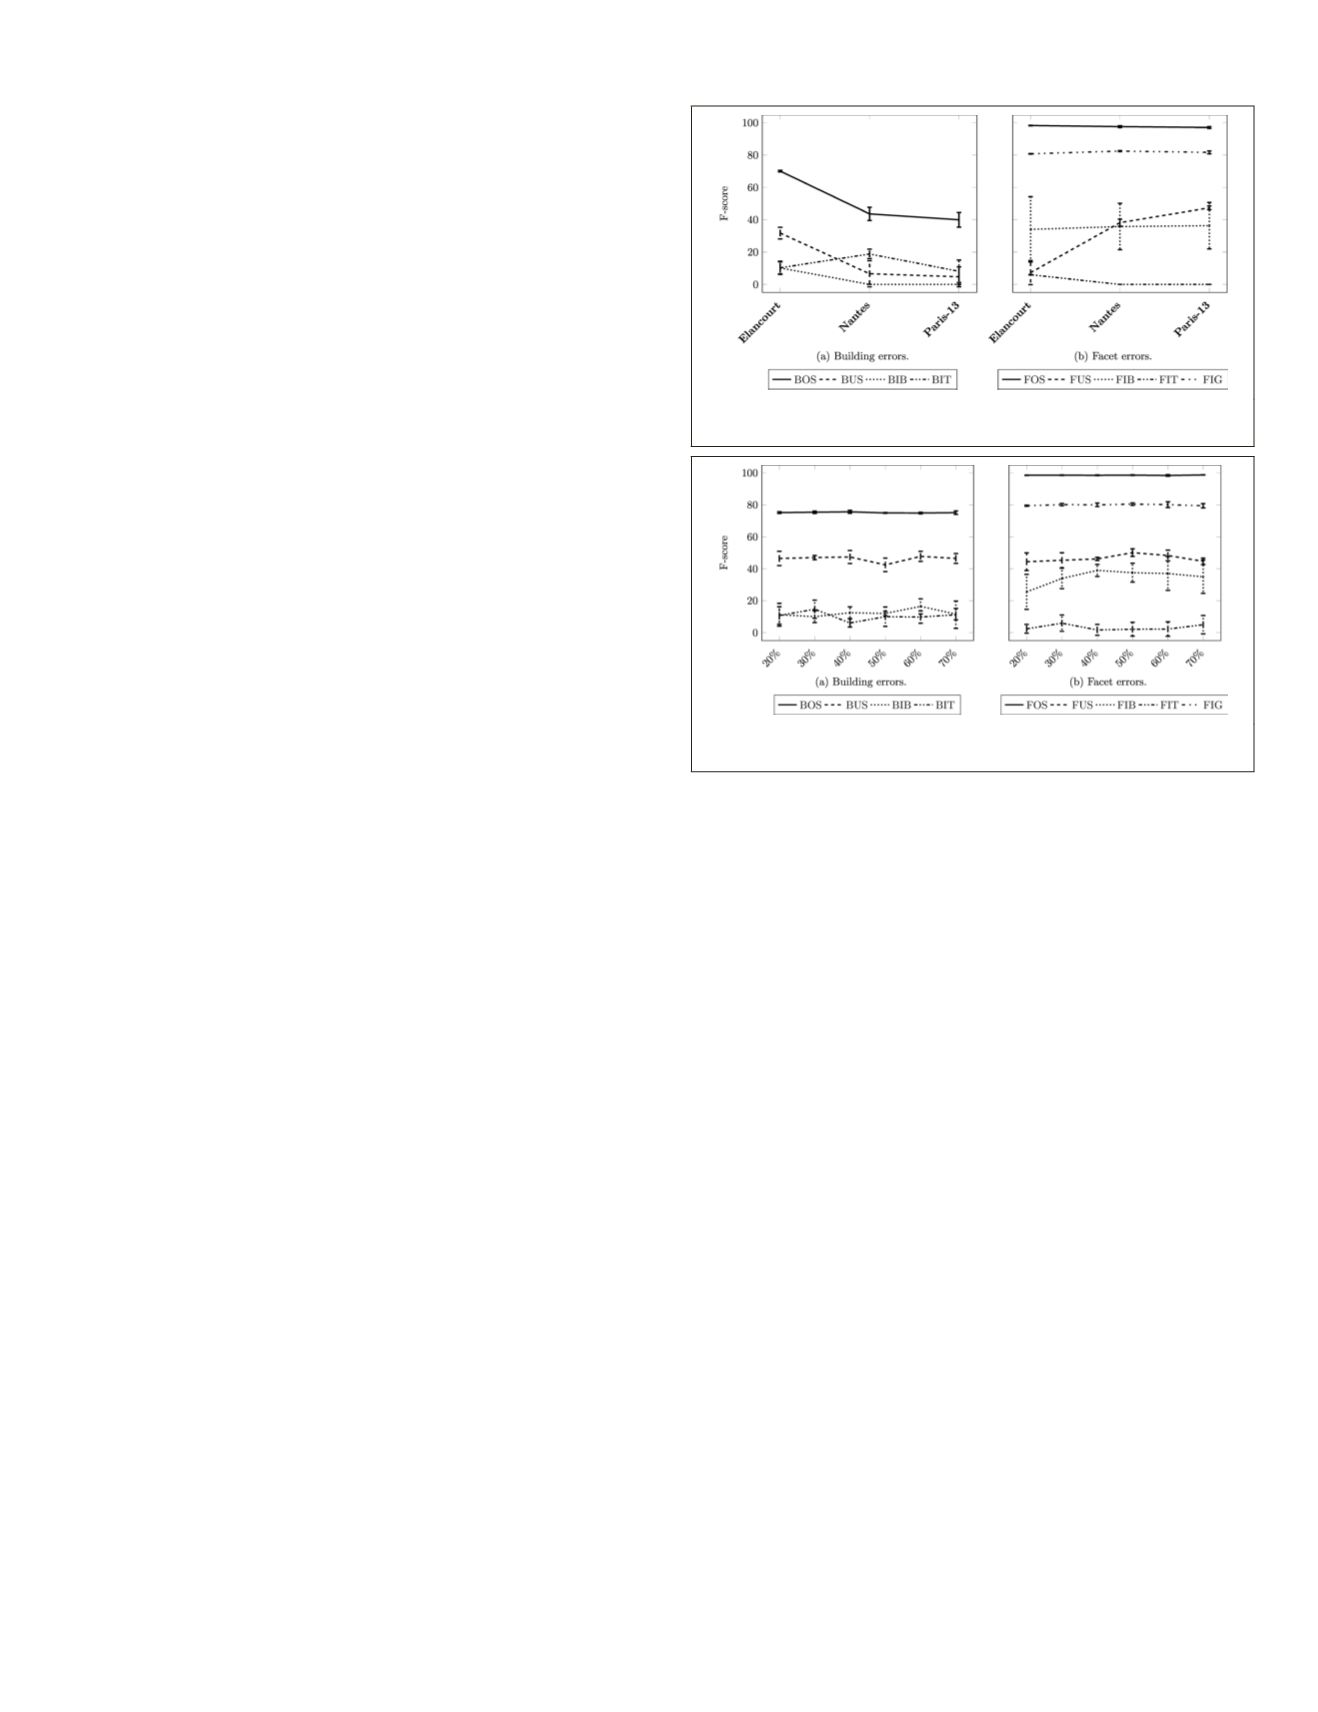
Nantes. The
F
-score evolution per experiment
and error is depicted in Figure 12.
We compare these experiments with t
the same area (cf. Table 4). We analyze r
criteria as the transferability study.
We start again with a comparison depending on error fami-
lies. Out of the 11 possibilities for the Building Errors family,
eight yield worse results. For the Facet Errors family, 6 out of
13 comparisons exhibit the same trend. This is worse than the
transferability comparisons in ratio. This results from the fact
that fusing more datasets, that are not tailored for a specific
error detection, does not help alleviating the problem. It only
evens out the best (resp. worst) performances by including the
best (resp
.
worst) urban scene in the training set.
Similarly to the previous study, image and height modali-
ties play a major role in error detection. Image-based features
are crucial for
FIB
,
BIB
,
FUS
, and
BUS
detection (Table 4).
Height-based attributes, however, induce a larger improve-
ment in predicting
FIG
and
BIT
, while geometric ones are rel-
egated to playing a minor role. Otherwise, a curiosity can be
noticed: only when fusing all modalities together, in Paris-13
and Nantes, does predictions improve for
BOS
.
We also confirm the observations about the best urban
scene for error prediction training. In this case, the best zone
should always give the worst scores. It is mostly the case with
all atomic errors, with the exception of
BIT
. This outlier can
be explained by the resemblance of the Paris-13 3D model
to Nantes (which was established to be the best) samples.
Indeed, for most labels, Nantes and Paris-13 reach the same
scores. However, the discrepancy in
F
-scores proves the
added value for each dataset.
Representativeness Study
The objective is to find out, after merging all training samples
from all datasets, what is the minimal amount of data that can
guaranty stable predictions. We can, thereafter, understand
how much learning on one scene typology can affect results
compared to a mixed training set. Figure 13 depicts
F
-score as a
tios (between 20–70%) and atomic errors.
tability of the
F
-score. This indicates
terogeneous dataset is not detrimental
ty and can be even the most suitable
solution.
BOS
,
FOS
, and
FIG
have a standard deviation under
2%, as opposed to
FIB
,
BIT
, and
FIT
. Indeed, they have large
variance, and even a larger standard deviation than mean
value. Scalability is, hence, ensured with a limited training
set. No standard logarithmic behavior can be found at the
studied scales. 20% of the full label set is sufficient so as to
retrieve results with a performance similar to the initial abla-
tion study. The best results are observed for
BOS
,
BUS
, and
FUS
.
These errors are topological defects of building roof facets
which require a high diversity of training samples for their de-
tection. More sophisticated features are however still required
to help predicting less frequent and more semantic labels.
Finesse Study
In this section, we reproduce the experimental settings de-
scribed in the previous two sections. This time, the finesse
level is fixed at 2. The goal is to find out how good, transfer-
able and stable are the model quality predictions at the seman-
tic level of error families (i.e., Building Errors vs. Facet Errors).
Error Family Detection
We start by the ablation study. Table 5 reveals that inserting
more remote sensing modalities do not change the prediction
Figure 12. Mean F-score and standard deviation for the
generalization study per test zone.
Figure 13. Mean F-score and standard deviation for the represent-
ativeness experiments depending on the training set size.
PHOTOGRAMMETRIC ENGINEERING & REMOTE SENSING
December 2019
875


