Transferability Study
In this configuration, we test how transferable are the learned
classifiers from one urban scene to another. We train on a
zone
Z
i
and test on another one
Z
j
. We will denote each trans-
ferability experiment by the couple (
Z
i
,
Z
j
) or by
Z
i
Z
i
. Six
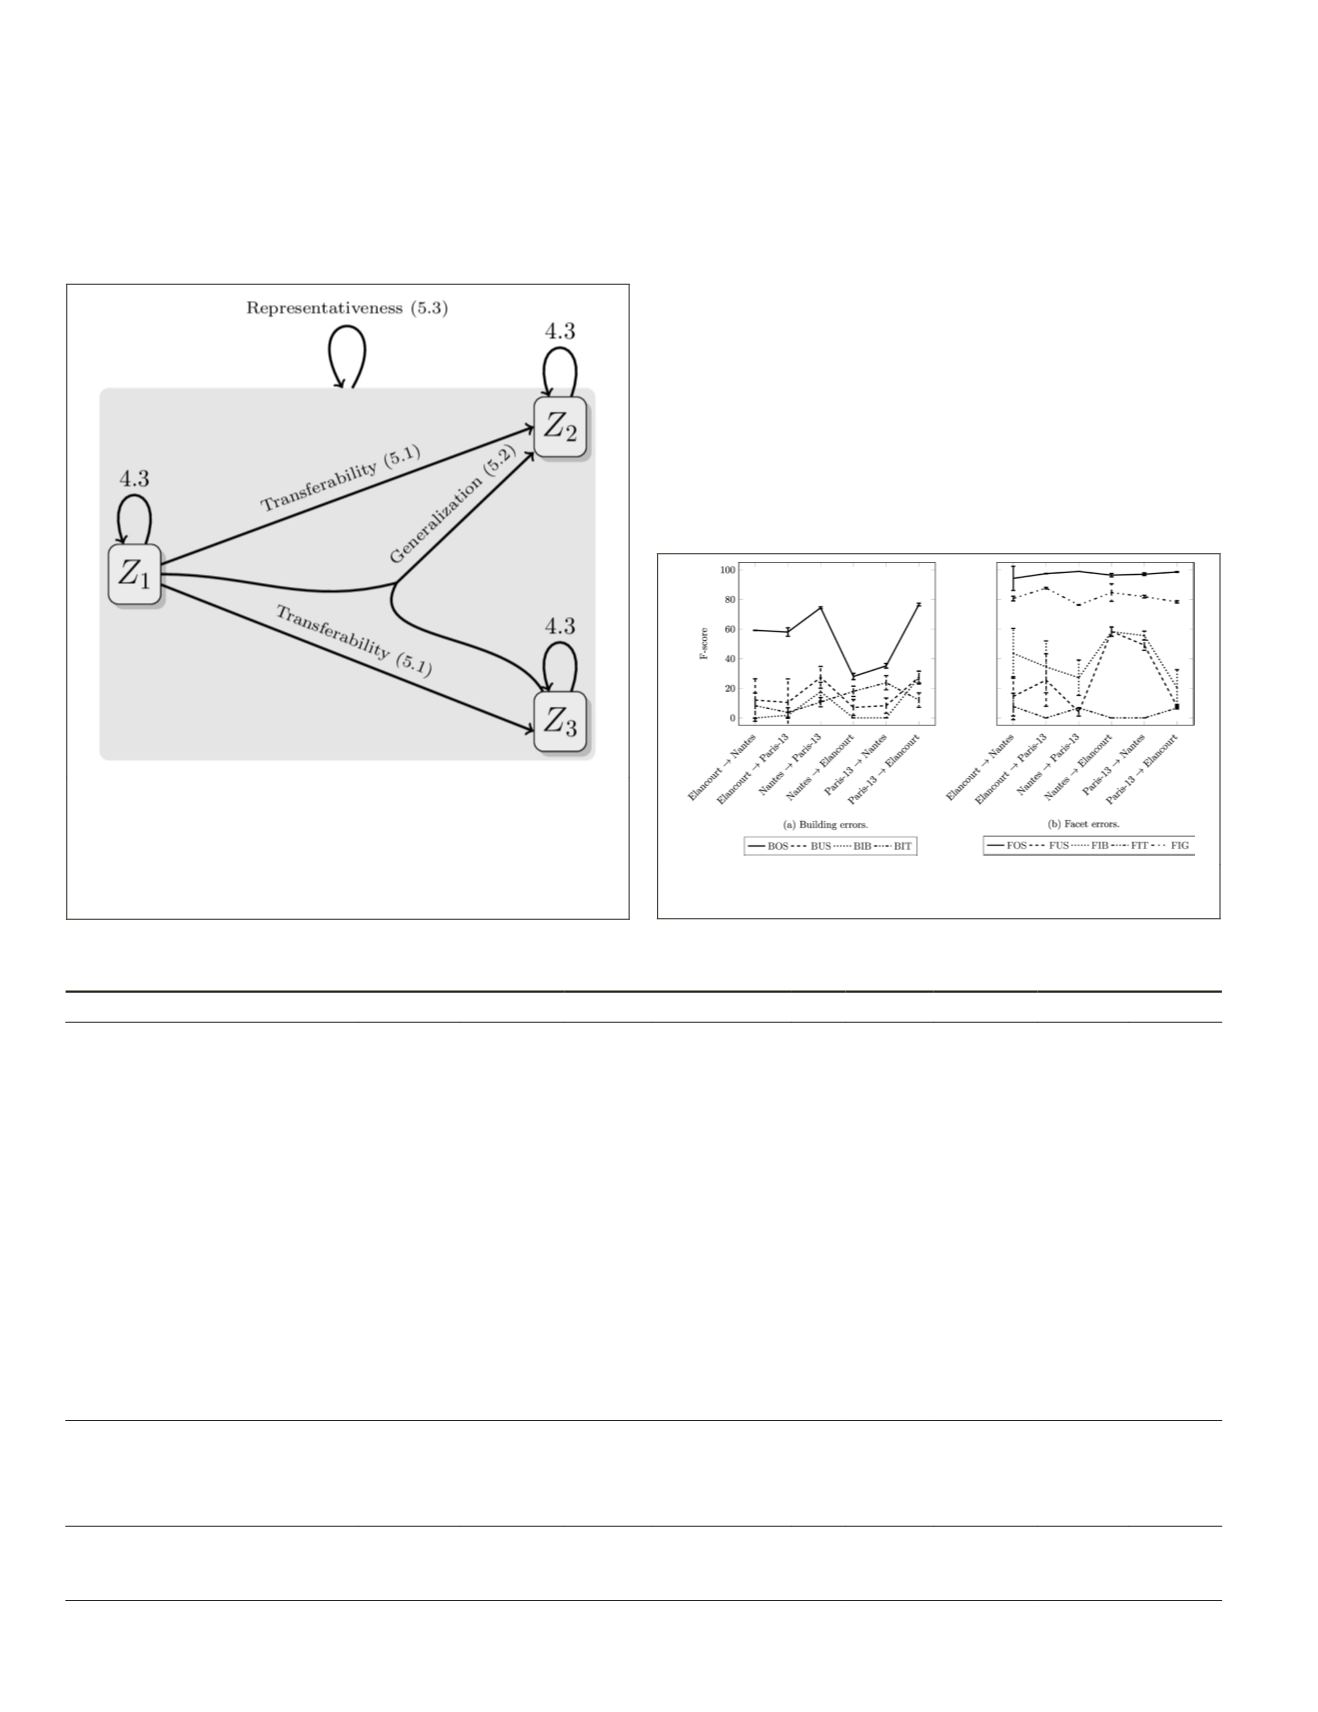
transferability couples are possible. F-scores are shown, per
label, and per experiment, in Figure 11.
First, a coherence analysis is performed. We compare
the results of the transferability experiments to the ablation
results with the same training scene (for a given area
Z
i
in all
couples (
Z
i
,
Z
j
)
"
i
≠
j
, differences between Figure 11 and Table
3/Figure 8). Second, we investigate how an urban scene
composition helps predicting defects in an unseen one. This
is called the projectivity comparison. For a given test scene
Z
j
in couples (
Z
i
,
Z
j
)
"
i
≠
j
, we compare results from Figure 11
with Table 3/Figure 8. Analysis is provided in Table 4. In both
settings, if a feature type appears, it means it is, by a large
margin, the most decisive one. A color scheme was devised to
encode the amplitude of change. All various feature configu-
rations are tested these experiments. If a modality stands out,
in terms of the F-score, it is mentioned in the corresponding
cell in Table 4.
To summarize the comparisons, error family wise, out of
22 Building Errors possible projectivity comparisons, 14 yield
worse results. This proves how hard it is, for this error family,
to transfer learned classifiers. It is, however, the contrary for
Figure 10. A graph representing possible experiments:
arrow origins represent training scenes while test ones are
depicted as targets.
Z
i
,
i
= 1, 2, 3 represent the urban zones.
All these nodes are assembled in one, meaning that all urban
scenes were aggregated in on train/test node. The numbers
indicate in which section each experiment is analyzed.
Figure 11. Mean F-score and standard deviation for the
transferability study.
Table 4. Evolution of the
F
-score value, for each error, between each tested configuration and the best result per area (section
“Feature Ablation Study”).
BOS
FUS FIB
FIT
FIG
Transferability
Coherence
Elancourt
Nantes
– – –
– –
– –
– –
– + (Im.)
+ + (Im.)
– (Im.)
+
Elancourt
Paris-13
– – –
– –
– –
– –
– + (Im.)
+ + (Im.)
–
+ +
Nantes
Paris-13
–
– –
∅
+ (Geom.)
– + +
+
∅
– (Hei.)
Nantes
Elancourt
+ +
–
+ +
+ (Geom.)
– – –
– –
+
–
Paris-13
Nantes
–
–
∅
+ + (Geom.)
– – – –
– –
∅
– –
Paris-13
Elancourt
+ +
+
+ +
+ (Geom.)
– – – – – –
+
–
Projectivity
Elancourt
Nantes
–
– –
–
– –
– –
+ + (Im.)
–
–
Elancourt
Paris-13
–
– –
–
– –
– + (Im.)
+ (Im.)
–
–
Nantes
Paris-13
–
– –
∅
– –
– +
+
∅
–
Nantes
Elancourt
+
–
–
+ (All)
– – –
– (Im.)
+ (Im.)
–
Paris-13
Nantes
– –
–
∅
+
– – – –
–
∅
– (Hei.)
Paris-13
Elancourt
–
–
+ (Im.)
–
– – – – – – – (Im.)
∅
–
General
Elancourt
– –
– – (Im.)
– –
– –
– + (Im.)
+ + (Im.)
(Geom.) – (Hei.)
Nantes
– (All)
– – (Im.)
– (Im.)
+ +
– –
– – (Im.)
∅
–
Paris-13
– – (All)
– –
∅
+ (Hei.)
– – – – – – – (Im.)
∅
–
Feature sets having a significant impact on the classification results are mentioned. Otherwise, Geom., Im., and Hei. contribute equally. The
symbols indicates the magnitude:
– – – – : [–45%, –35%[, – – – :[–35%, –25%[, – – :[–25%, –15%[, – : [–15%, –5%[, + : [5,15%[,
+ + : [15,25%]
,
∅
: statistics cannot be computed.
Table 5. Feature ablation study on the three datasets for the finesse = 2 case.
874
December 2019
PHOTOGRAMMETRIC ENGINEERING & REMOTE SENSING


