land-cover object collected at different times, which is also
aggravated by human activity in man-made objects (especially
for land-use and land-cover classes in urban areas) (Mili-
aresis, 2014); and (d) ambiguous boundaries of land objects
are caused by heat diffusion (Rodríguez-Galiano
et al.
, 2012),
which seriously affects the classification performance at a fine
spatial resolution (0.2 m in this study). As for the
VIS
dataset,
interpretation is also difficult due to the fact that
VHSR
imagery
exhibits severe intra-class variations. As for the combination of
these two datasets, the swath width of the
TI-HSI
data is greater
than that of the
VIS
data, which results in large image gaps
within the
VIS
data. In our proposed approach, an effective
inpainting method is proposed to undertake the gap filling.
Based on this analysis of the two datasets, ambigu-
ous boundaries are ubiquitous in the
TI-HSI
data, while the
boundaries in the
VIS
data with a fine spatial resolution are
very clear. The significant intra-class variations and relatively
low inter-class separability of the
VIS
data also limits the
classification performance. In addition, roads in the
TI-HSI
data are significantly different from the other classes, and the
rest of the classes can be effectively distinguished in light of
the fine spatial details of the
VIS
data. In order to tackle the
aforementioned problems, a multi-level fusion framework for
land-use and land-cover classification is proposed to integrate
the complementary and discriminative features of the two
datasets. The major contributions of this article are: (a) a full
analysis of the challenges posed by the newly released dataset
combination is presented; and (b) a novel framework that fully
considers the challenges of the classification task is proposed.
The rest of this paper is organized as follows. The next
section introduces the datasets and analyzes the problems en-
countered when dealing with this classification task, followed
by the details for the proposed multi-level fusion framework.
The experimental results and analysis are then described
leading to our conclusions.
Challenges and Analysis
As this airborne dataset combination is newly released, an
introduction to the datasets and an analysis of the problems
encountered in their integration are needed.
Introduction to the Datasets
The airborne
TI-HSI
data consist of 84 spectral bands in the
868 to 1280 cm
−1
region (7.8 to 11.5
μ
m), at a spectral reso-
lution of 6 cm
−1
(full-width-half-maximum) and with an
approximately 1.0 m spatial resolution. The data have been
calibrated to at-sensor spectral radiance in W/(m
2
srcm
–1
). The
VIS
data were acquired almost simultaneously, and have been
resampled to a 0.2 m spatial resolution. In view of this, clas-
sifying the urban land-use and land-cover types at the 0.2 m
spatial resolution level is a multi-resolution fusion task. The
average height of the sensor platforms was 807 m.
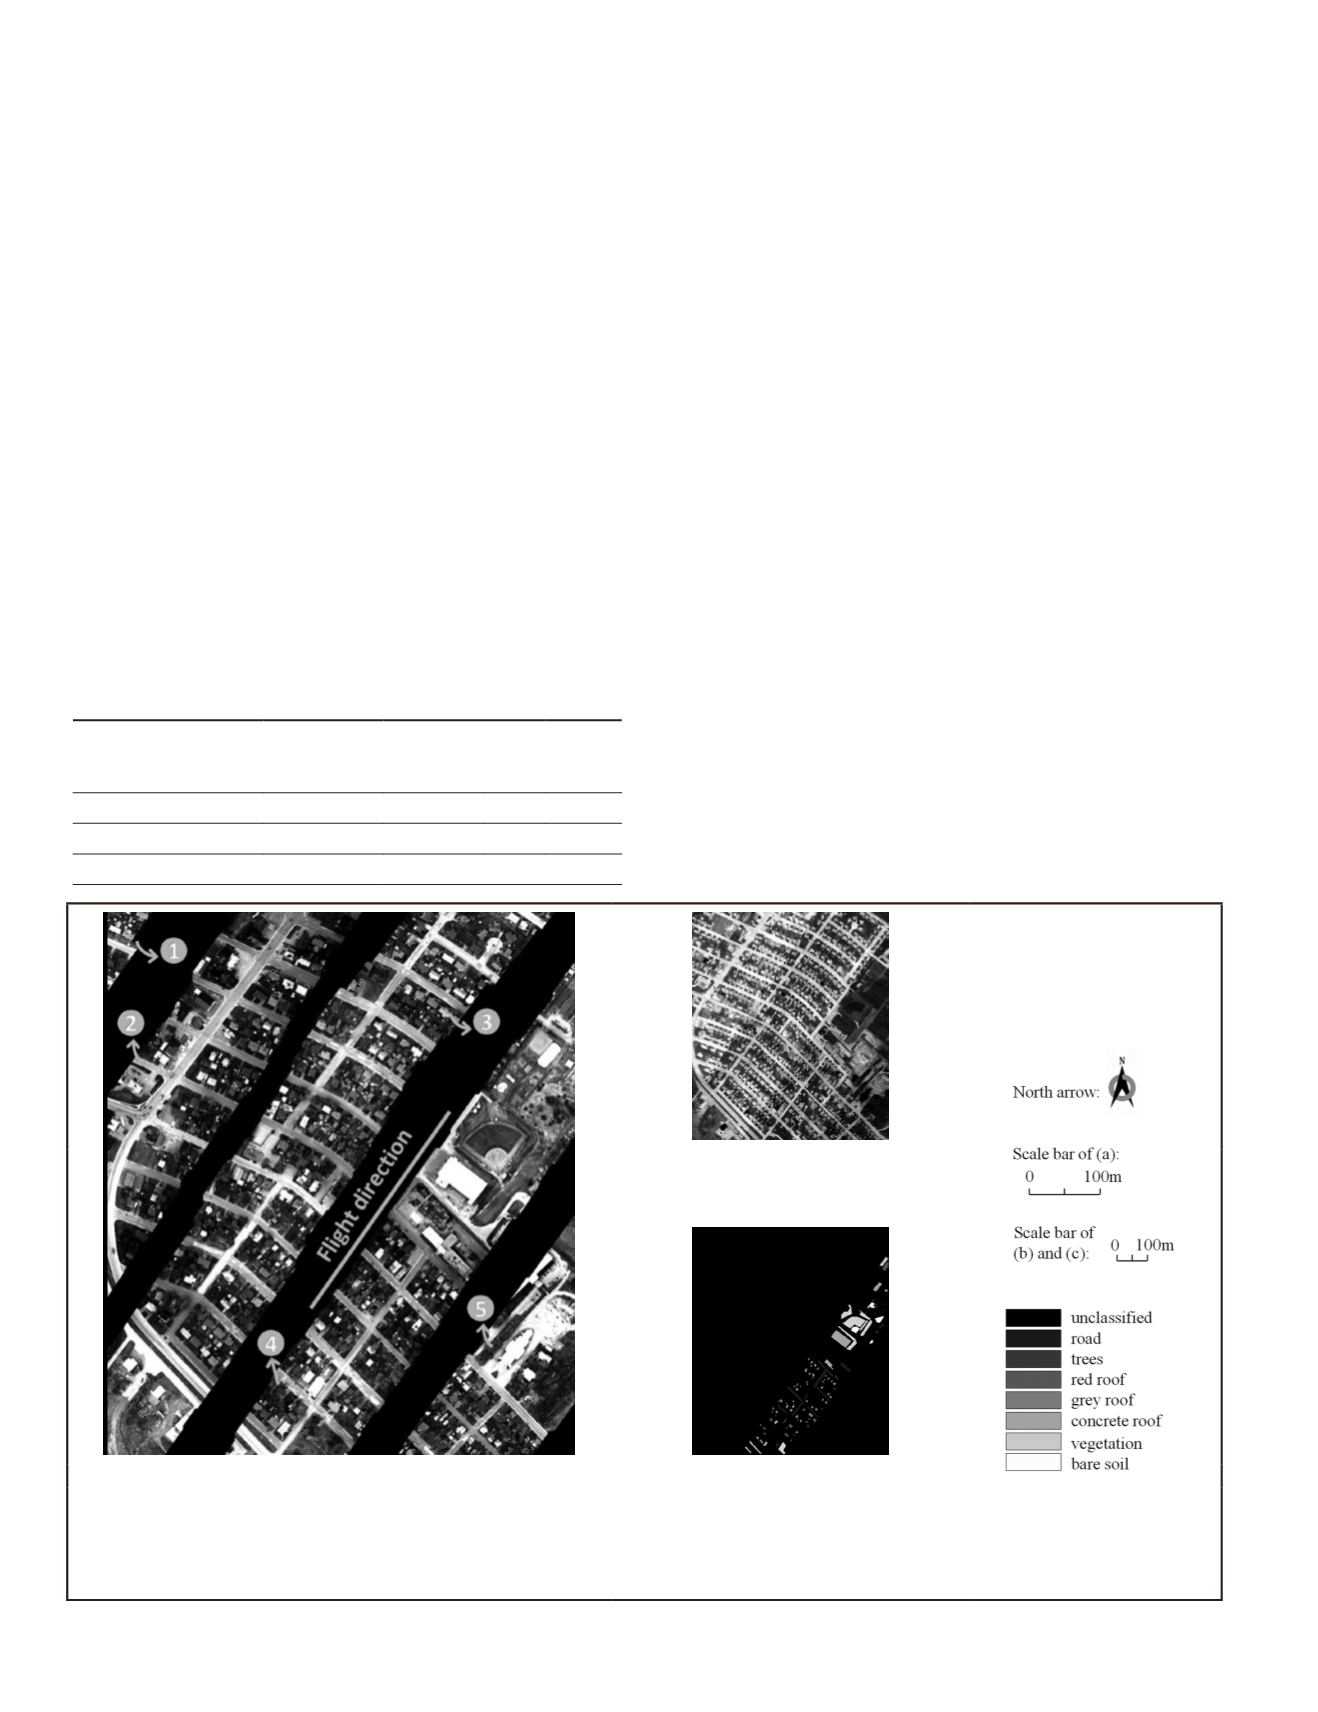
The grayscale map of the red band of the
VIS
data and the
grayscale map of the first band of the
TI-HSI
data are visually
shown in Figure 1a and 1b, respectively. The two datasets
cover an urban area near Thetford Mines in Québec, Canada,
on 21 May 2013, between the time 22:27:36 to 23:46:01 UTC.
A nearby meteorological station, located at geographic coor-
dinates 46°02'57.002"N and 71°15'58.004"W and, and 430.0 m
(b)
(a)
(c)
Figure 1. Datasets and labeled sample locations of the study area: (a) The red band of the VIS data; there are five strips in the image -
the width of the gaps between two neighboring strips is large; (b) The first spectral band of the TI-HSI data, showing the obvious intensity
discrepancy across the flight direction; and (c) Labeled sample locations of the study area, which are all in the fourth strip. The class label
grayscale bar applies to all the figures. It should be noted that the spatial ratio between these two datasets is 5:1, but the sizes of the
sub-figures here do not follow this ratio, which should not affect the readability.
T
able
1. E
nvironmental
D
ata
D
uring
A
cquisition
of
the
T
wo
D
atasets
. T
he
V
ariations
C
learly
I
nfluence
the
R
adiant
E
nergy
of
the
TI-HSI
dataset
,
as
can
be
V
isually
S
een
in
F
igure
1
b
UTC date and time
Temperature
[°C]
Dew point
temp.
[°C]
Rel.
hum.
[%]
Pressure
[kPa]
21 May 2013, 22:00:00
14.2
9.6
74 96.41
21 May 2013, 23:00:00
13.1
9.4
78 96.48
22 May 2013, 00:00:00
12.5
9.3
81 96.43
902
December 2015
PHOTOGRAMMETRIC ENGINEERING & REMOTE SENSING


