elevation, recorded the environmental data during image
acquisition, as shown in Table 1.
Challenges for Classification
Classification with such a subtle spectral resolution in the
thermal infrared range and with such high spatial resolution
datasets certainly poses some challenges.
Challenges Posed by the TI-HSI Dataset
A. Low Energy, Low SNR, and High Inter-band Correlation
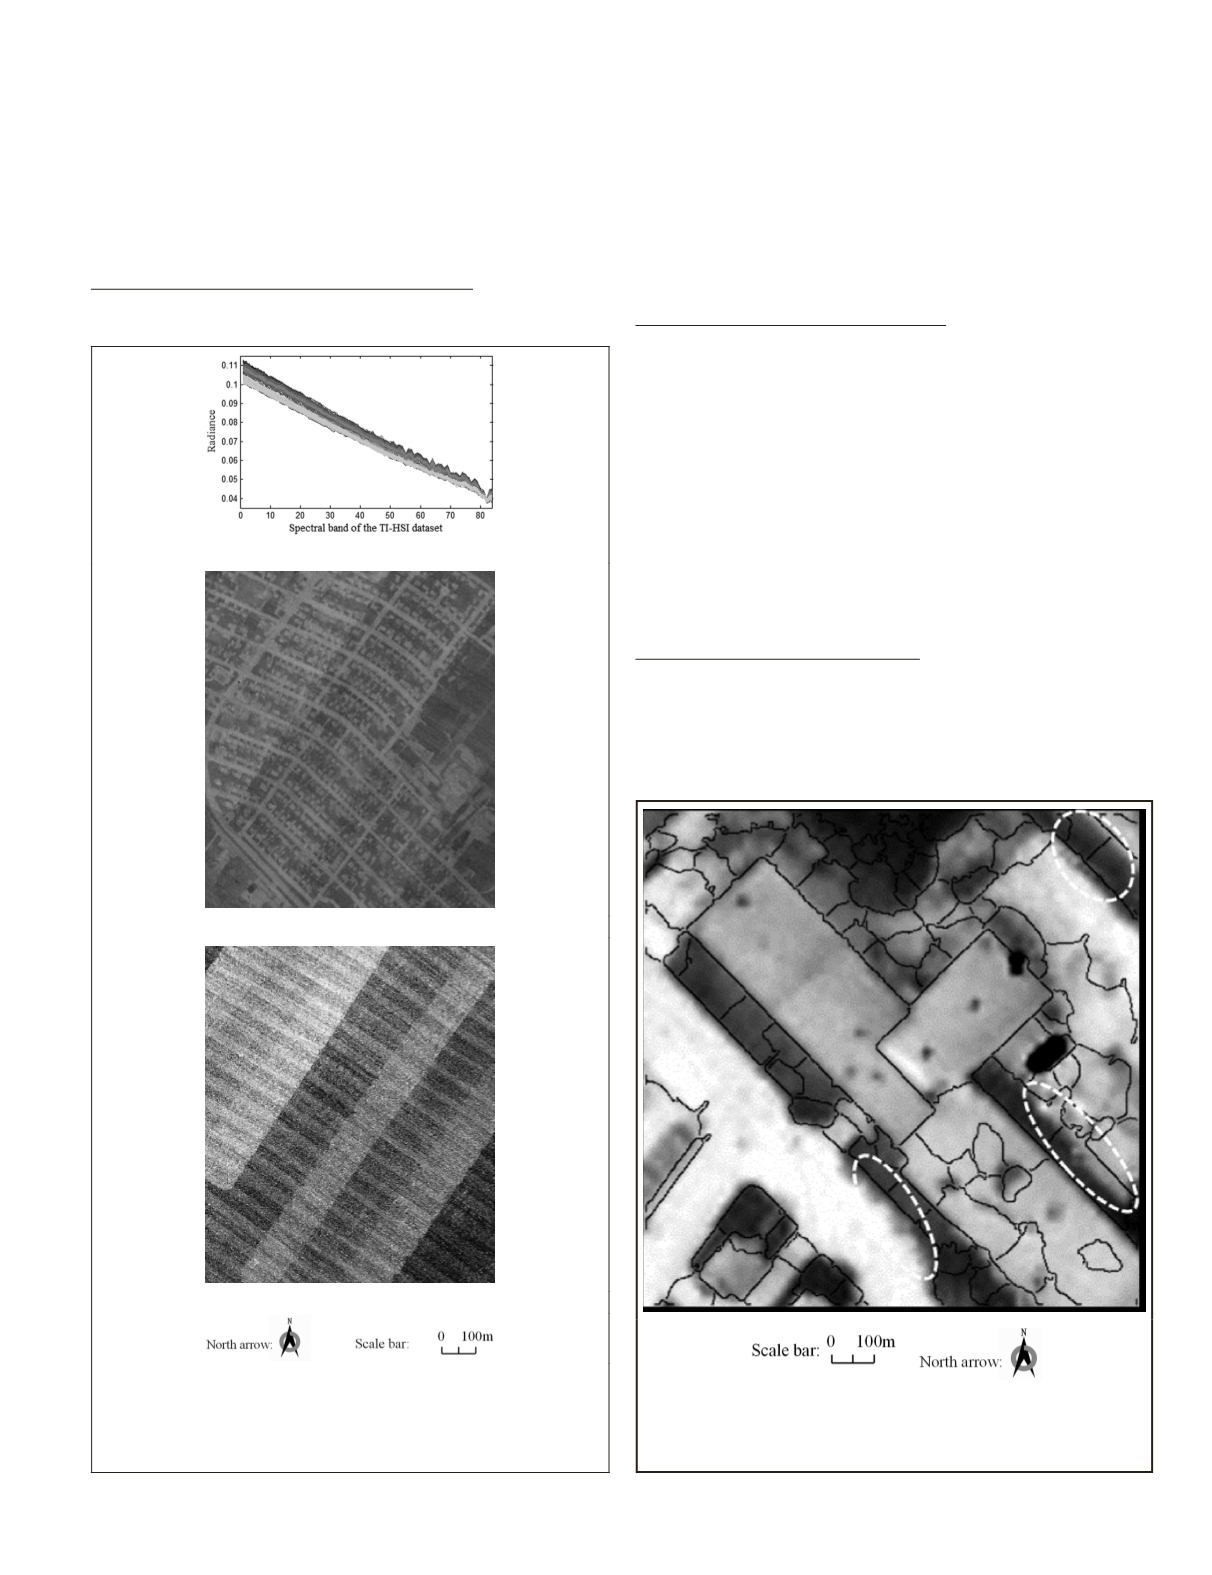
Figure 2a shows the representative spectral curves of each
class in the original
TI-HSI
dataset, where the horizontal axis
records the number of bands, and the vertical axis represents
the radiant energy. It can be seen in Figure 2a that the radiant
energy is quite limited, as the maximum vertical value is less
than 0.12. Furthermore, there is significant linear correlation
between the radiant energies in different bands, which means
that high spectral redundancy exists in the dataset. For the
noise issue, taking the 80
th
spectral band shown in Figure 2b
as an example, it can be seen that the noise is non-negligible.
In addition, Figure 2c displays the uninformative 82
nd
band of
the
TI-HSI
data, which contains little useful information.
B. Spectral Variation and the Over-fitting Issue
As can be seen in Figure 1, five sequentially acquired strips
make up the whole scene. Compared with the
VIS
data, the
thermal radiant energy and spectral discrimination are deter-
mined not only by the land-cover material type, but also by
the temperature. The radiant energy of the
TI-HSI
dataset is
sensitive to the environmental change occurring during the
data acquisition (see Table 1), as can be seen in the obvious
intensity discrepancy across the flight direction, as shown in
Figure 1b, while the
VIS
reflectance is relatively stable.
For classification, over-fitting is one of the most important
problems, as noted in Chapter 1.4.7 in Murphy (2012). For the
study area, the locations of the labeled samples show obvi-
ous spatial correlation and redundancy, as shown in Figure
1c. Both the redundant training samples in a local region and
spectral variation will aggravate the over-fitting issue.
C. Ambiguous Boundaries of Land Objects
For
TI-HSI
data, it is well known that the ambiguous bound-
aries of land objects seriously affect image interpretation
accuracy at a fine spatial resolution. To illustrate this prob-
lem, some of the blurry boundaries of the
TI-HSI
data are
highlighted in white ellipses in Figure 3, and compared with
the segmentation result of the
VIS
dataset. Since the spatial
(a)
(b)
(c)
Figure 2. The low quality of the TI-HSI dataset: (a) Representa-
tive spectral curves of each class in the original TI-HSI dataset;
(b) grayscale map of the 80
th
spectral band of the original TI-HSI
dataset; and (c) grayscale map of the 82
nd
spectral band of the
original TI-HSI dataset.
Figure 3. Illustration of boundaries in the two datasets: a sub-
region of the TI-HSI data with the VIS segmentation boundaries.
As the VIS dataset can offer dedicated edge information, the VIS
segmentation boundaries are considered believable.
PHOTOGRAMMETRIC ENGINEERING & REMOTE SENSING
December 2015
903


