To evaluate the surface accuracy of the
UAV
-
SfM
procedure,
TLS
and
ALS
point clouds were compared with the
UAV
-derived
point cloud. Both surfaces had very similar point densities,
but artifacts from the interpolation process may have had an
effect on these comparisons. Note that the vertical accuracy of
photogrammetry-derived digital terrain models was at least as
good as that of airborne lidar (Hodgson and Bresnahan 2004),
but less accurate than that of
TLS
.
A zone (green zone in Figure 1) with flat topography
change was selected to check the accuracy of the
DSM
.
TLS
was
compared with the
ALS
-derived and camera-derived
DSMs
. Fig-
ure 8 illustrates that the differences in elevation were almost
completely neutral throughout the study area (indicated by
the yellow colors).
The histogram distribution shows that the differences be-
tween the
DSMs
generated by each camera and the
TLS
data were
less than 1 pixel
GSD
for 75% of the data. The
NX DSM
showed
the highest agreement with the
TLS DSM
. The height differ-
ence between
ALS
and
TLS
histograms shows an approximately
Gaussian distribution. The S7
RS
option on/off and
NX
all
showed quasi-Gaussian curves. These results demonstrate that
all of the surfaces had excellent vertical accuracy. The vertical-
difference standard deviation for the
NX
and the
TLS DSM
was
only 0.024 m, which was closest to the
TLS
results (Figure 9).
The cameras yielded
RMSE
values of 0.048, 0.038, and
0.024 m. Note that the
GSDs
for the S7 and
NX
are 0.0449 and
0.0372 m, and
RMSEs
were within 1 pixel of the
GSD
.
The profiles in the sloped area (Figure 10) are extracted
and plotted. Sloped areas have higher sensitivity than flat
areas. Figure 10 shows the
DSM
differences (red) between each
camera, based on changes in the elevation of the topography
(black), and the
TLS
. Compared to the flat area, topographic
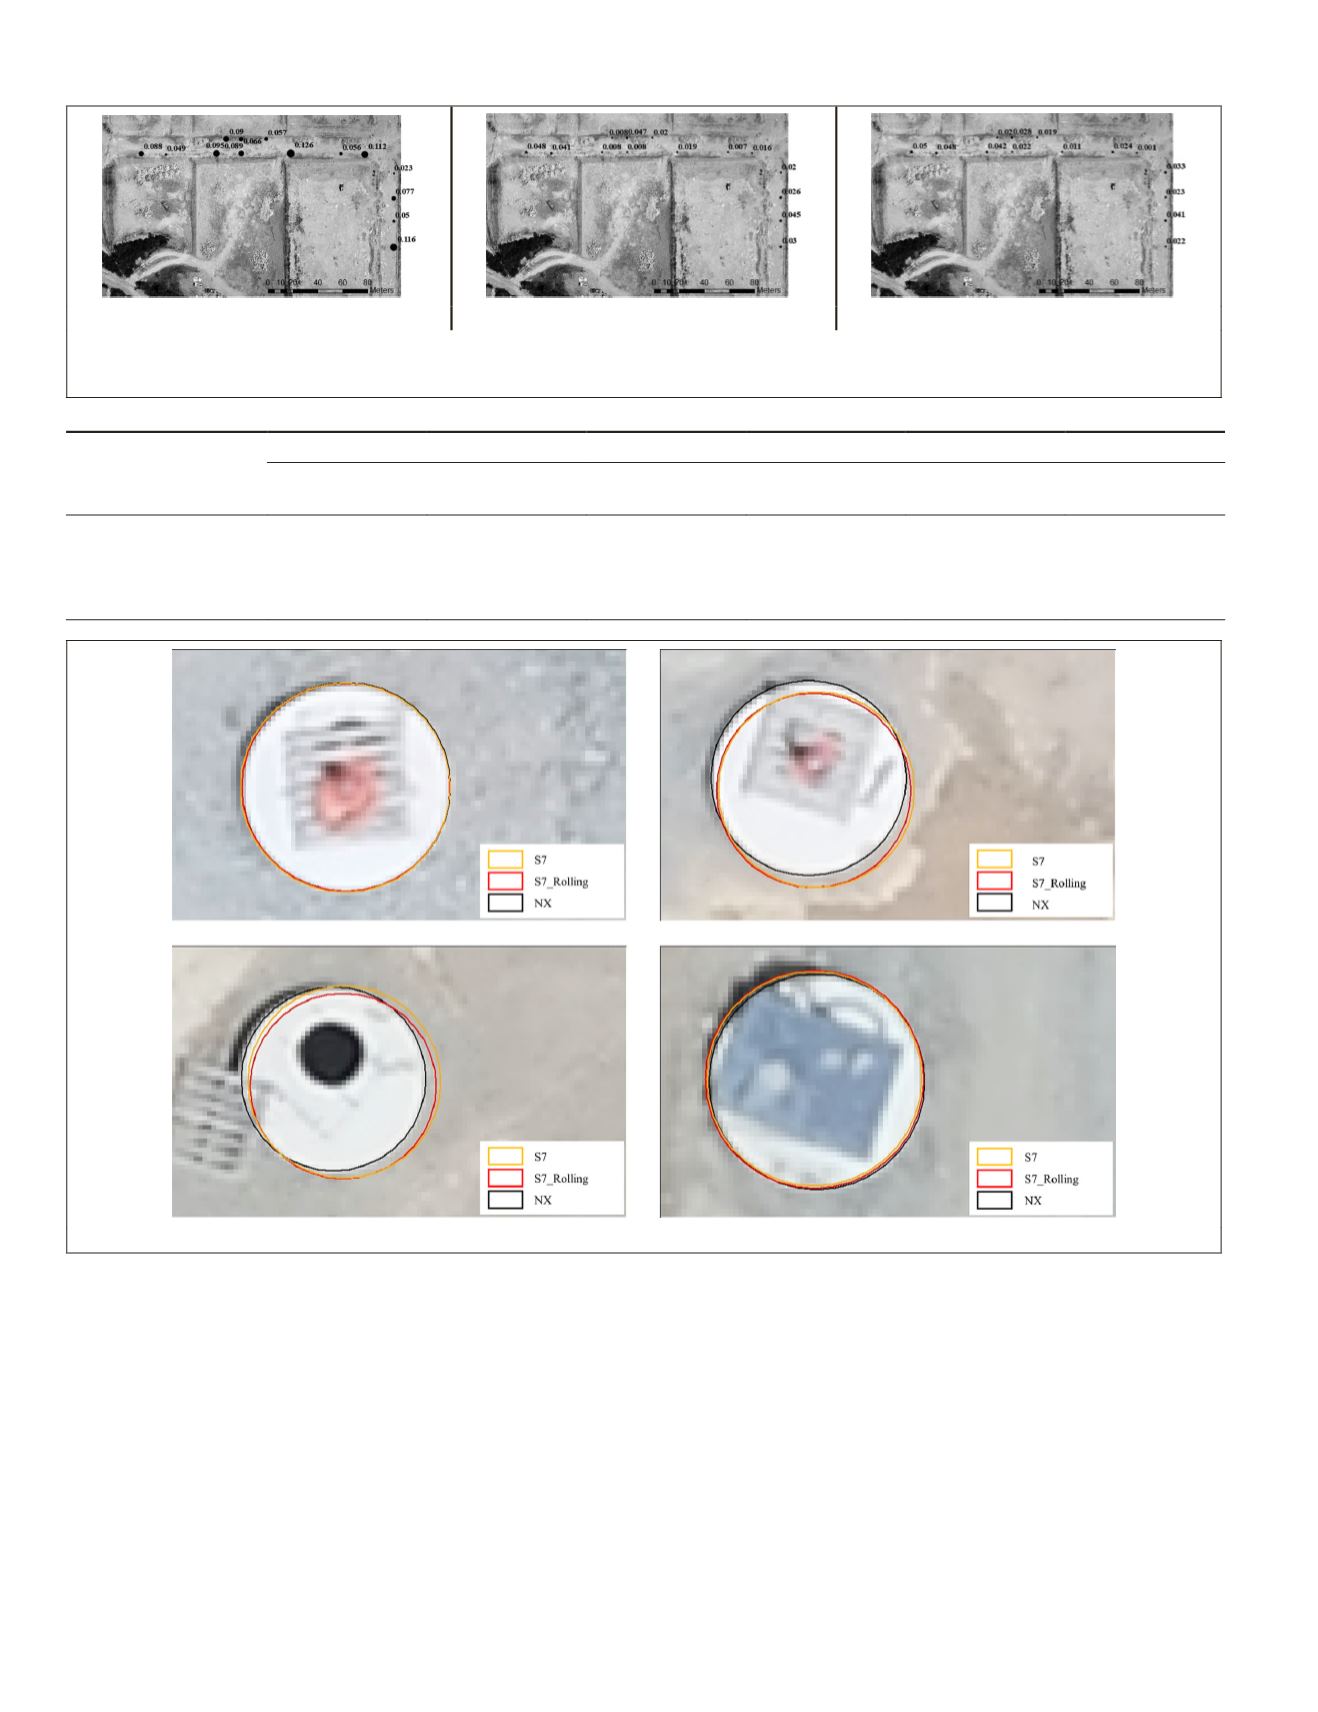
(a) S7 (Rolling Shutter option off)
(b) S7 (Rolling Shutter option on)
(c) NX
Figure 6. The checkpoint errors in the
UAV
-generated mosaic data (m). Sizes of points are proportional to the size of the
difference between calculated checkpoint and
GNSS
-surveyed checkpoint: (a) S7 (rolling-shutter option off), (b) S7 (rolling-
shutter option on), (c)
NX
.
Table 6. Polygon area comparison. The surveyed manhole size is 2.011 m2.
Polygon
S7
NX
Rolling Shutter Off
Rolling Shutter On
Area
Difference
Area
Difference
Area
Difference
Minimum (m
2
)
1.968
−0.043
2.022
0.011
1.1982
−0.028
Maximum (m
2
)
2.070
0.059
2.088
0.077
2.042
0.031
Average (m
2
)
2.022
0.012
2.040
0.029
2.024
0.013
Standard deviation (m
2
)
0.051
0.032
0.028
Figure 7. Accuracy of orthoimages. Manholes are delineated by screen digitization on the orthoimage and field survey .
894
December 2019
PHOTOGRAMMETRIC ENGINEERING & REMOTE SENSING


