Experiments and Discussion
Study Area and Data Source
We used three sets of
GF1
images obtained by the four
WFV
cameras to validate the effectiveness of the proposed method.
The experimental data included Band 2 images after radi-
ometry correction, calibrated camera parameters based on
the traditional method, and auxiliary data. Table 2 provides
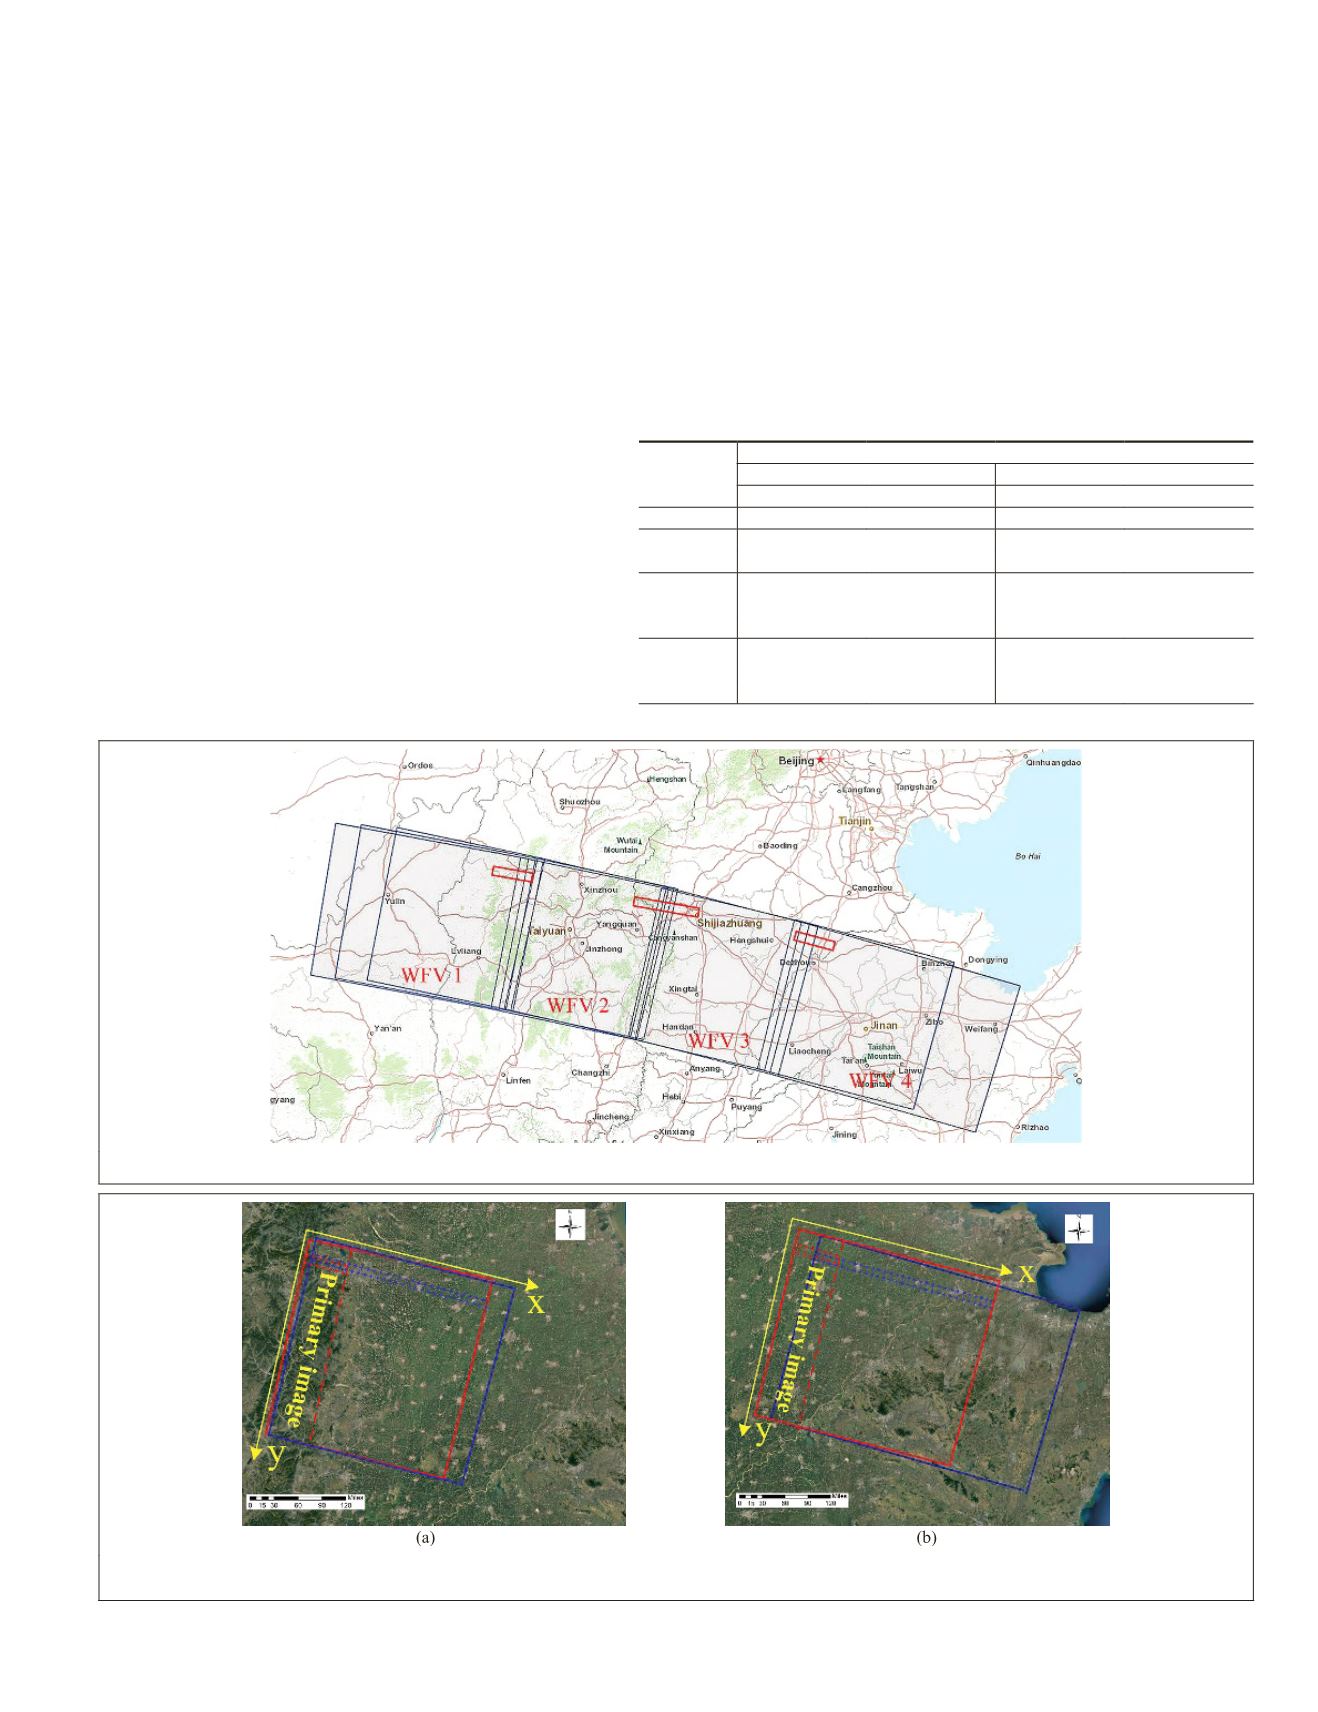
details of the selected stereoscopic images, and the blue
squares in Figure 10 show their distribution and overlap-
ping relationship. Images obtained by
WFV1
and
WFV2
were
triple overlapped, and their terrain was mainly plateaus and
mountains; therefore, they were used to validate the proposed
self-calibration model for three stereoscopic images, without
the aid of the reference
DEM
. Images obtained by
WFV3
and
WFV4
were double overlapped, and their terrain was
mainly flat; therefore, they were used to validate the pro-
posed self-calibration model for paired stereoscopic im-
ages. The high-accuracy
DOM
and
DEM
generated by the
Ziyuan 3 (ZY3) satellite were used as reference data for
the performance of self-calibration and the evaluation of
calibration accuracy. The
DOM
resolution was 2.0 m and
its plane accuracy was 5.0 m (root-mean-square). The
DEM
resolution was 5.0 m, and its height accuracy was
3.0 m (root-mean-square). The high-accuracy reference
data used to perform self-calibration only covered small
parts of the imagery data (red squares in Figure 10), and
the reference data used to evaluate the self-calibration
accuracy covered the whole region of the imagery data. The
reference
DEM
(
GDEM2
) was used in the self-calibration model
for paired stereoscopic images to verify universality when
the terrain was relatively flat.
GCPs
for calibration and accu-
racy evaluation were extracted from the
DOM
and
DEM
by the
scale-invariant feature transform algorithm, with a matching
accuracy greater than about 0.3 pixel (Lowe 2004).
Self-Calibration Experiments with WFV3 and WFV4
Images obtained by the
WFV3
and
WFV4
cameras were used to
verify the effectiveness of the proposed self-calibration ap-
proach for paired stereoscopic images. Based on the overlap-
ping relationship of the paired stereoscopic images shown in
Figure 11 (red squares are from image set 1 in Table 2; blue
Figure 10. Distribution and overlapping relationship of the experimental stereoscopic imagery data.
Figure 11. Overlapping relationship of the paired stereoscopic images. (a) Stereoscopic image pair obtained from the
WFV3
camera. (b) Stereoscopic image pair obtained from the
WFV4
camera.
Table 2. Detailed description of the satellite imagery data.
Sensors
Overlapping Type
Triple
Double
WFV1
WFV2
WFV3
WFV4
Set 1
Time
21 Nov 2017 21 Nov 2017 21 Nov 2017 21 Nov 2017
Location E110.3_N38.0 E112.7_N37.6 E114.8_N37.3 E116.9_N36.8
Set 2
Time
20 Dec 2017 20 Dec 2017 20 Dec 2017 20 Dec 2017
Location E110.8_N38.0 E112.8_N37.6 E114.9_N37.2 E117.4_N36.7
Set 3
Time
31 Aug 2017 31 Aug 2017
Location E110.6_N38.0 E112.9_N37.6
PHOTOGRAMMETRIC ENGINEERING & REMOTE SENSING
November 2019
821


