selected
GCPs
, and the remaining
GCPs
can be used to evaluate
the relative positioning accuracy. The root-mean-square error
following calibration was better than 1.0 pixel when a small
number of
GCPs
was used (Table 6).
Self-Calibration Experiments with WFV1 and WFV2
Images obtained from the
WFV1
and
WFV2
cameras were used
to verify the effectiveness of the self-calibration approach
based on intersection residual error. Because their over-
lapping relationship was different from that of the paired
stereoscopic images obtained from the
WFV3
and
WFV4
cam-
eras (Figure 14, red squares are from image set 1 in Table 2;
blue squares are from image set 2 in Table 2; purple squares
are from image set 3 in Table 2), to reduce the dependence on
the calibration field, the rightmost 3000
CCDs
were selected
as the primary
CCDs
during the self-calibration. The rightmost
stereoscopic image was selected as the benchmark image
(Figure 14, image set 3, purple square). Because the selected
primary
CCD
part was the opposite of that used in the first ex-
periment, to make the proposed stepwise internal-parameter
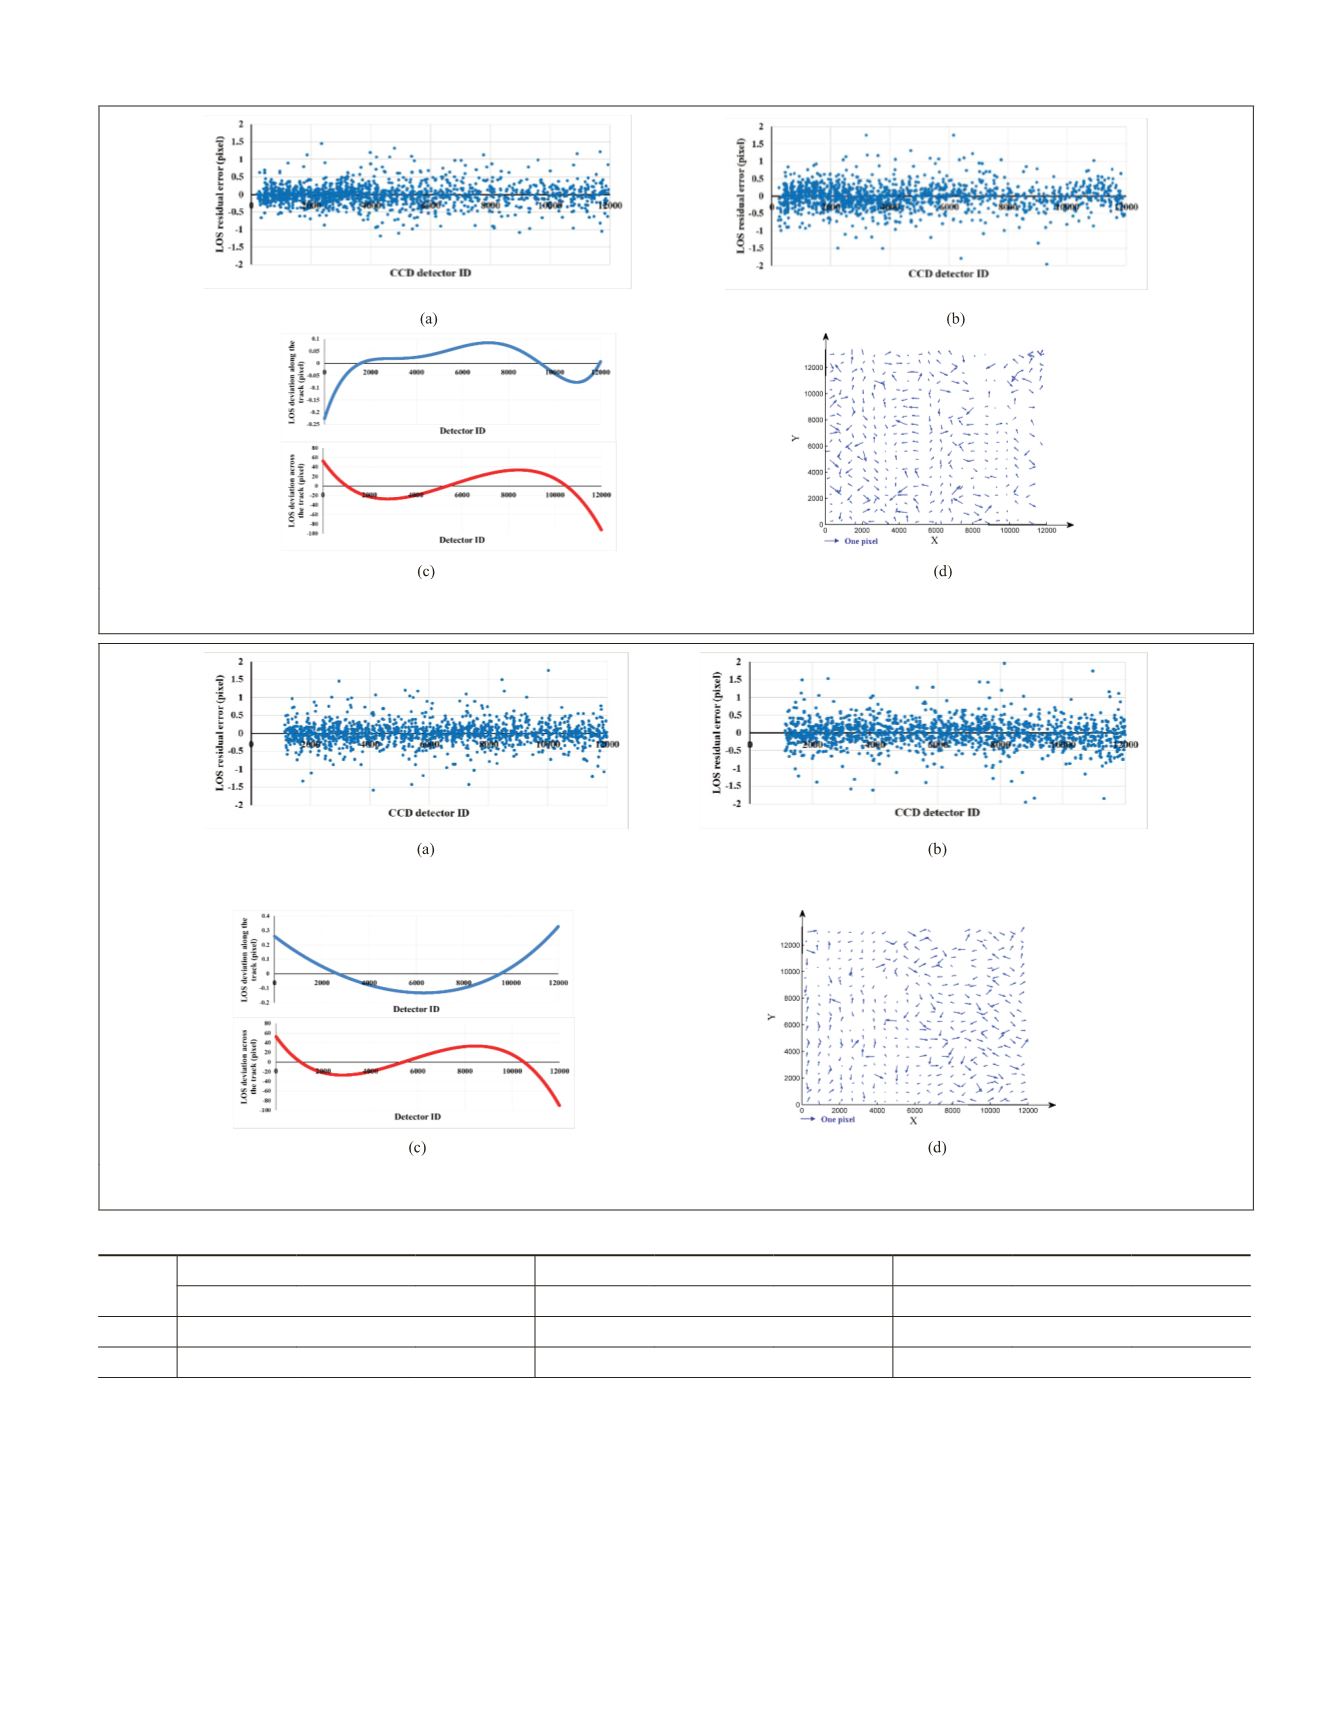
Figure 12. Calibration results for the
WFV3
camera. (a) Line-of-sight residual error along the track. (b) Line-of-sight residual
error across the track. (c) The internal distortion curve. (d) The positioning residual error vectors after calibration.
Figure 13. Calibration results for the
WFV4
camera. (a) Line-of-sight residual error along the track. (b) Line-of-sight residual
error acrzoss the track. (c) The internal distortion curve. (d) The positioning residual error vectors after calibration.
Table 5. Positioning accuracy (root-mean-square; pixels) before and after calibration of internal distortion (
WFV3
and
WFV4
).
Camera
Before
Traditional Calibration
Self-Calibration
Sample
Line
Plane
Sample
Line
Plane
Sample
Line
Plane
WFV3
35.276
3.565
35.445
0.393
0.402
0.562
0.424
0.449
0.617
WFV4
35.391
3.972
35.611
0.481
0.512
0.702
0.477
0.575
0.747
PHOTOGRAMMETRIC ENGINEERING & REMOTE SENSING
November 2019
823


