from 0.2442 to 0.1083 and the overall optimization degree
reaches 55.7%. All four algorithms have different degrees of
improvement, and the overall optimization degree is between
25.6% and 55.7%. These results indicate that the optimiza-
tion algorithm is effective and has good adaptability to differ-
ent endmember extraction algorithms.
However, except for
SGSNMF
, which optimizes all features,
the other three optimized methods are not optimized for the
tree. In
VCA
, the
SAD
is rising from 0.0472 to 0.0656. In
MVC-
NMF
, the
SAD
is rising from 0.0319 to 0.0854. In
ASSNMF
, the
SAD
is rising from 0.0496 to 0.0939. These data have one thing
in common: tree is the most accurate feature in the initial
endmember matrix; its
SAD
is the smallest before. Because the
objective function is set to be overall optimal, so in the itera-
tive process endmembers are optimized gradually. However,
before optimization, the tree has reached the optimum. There-
fore, after the optimization process, its accuracy is reduced.
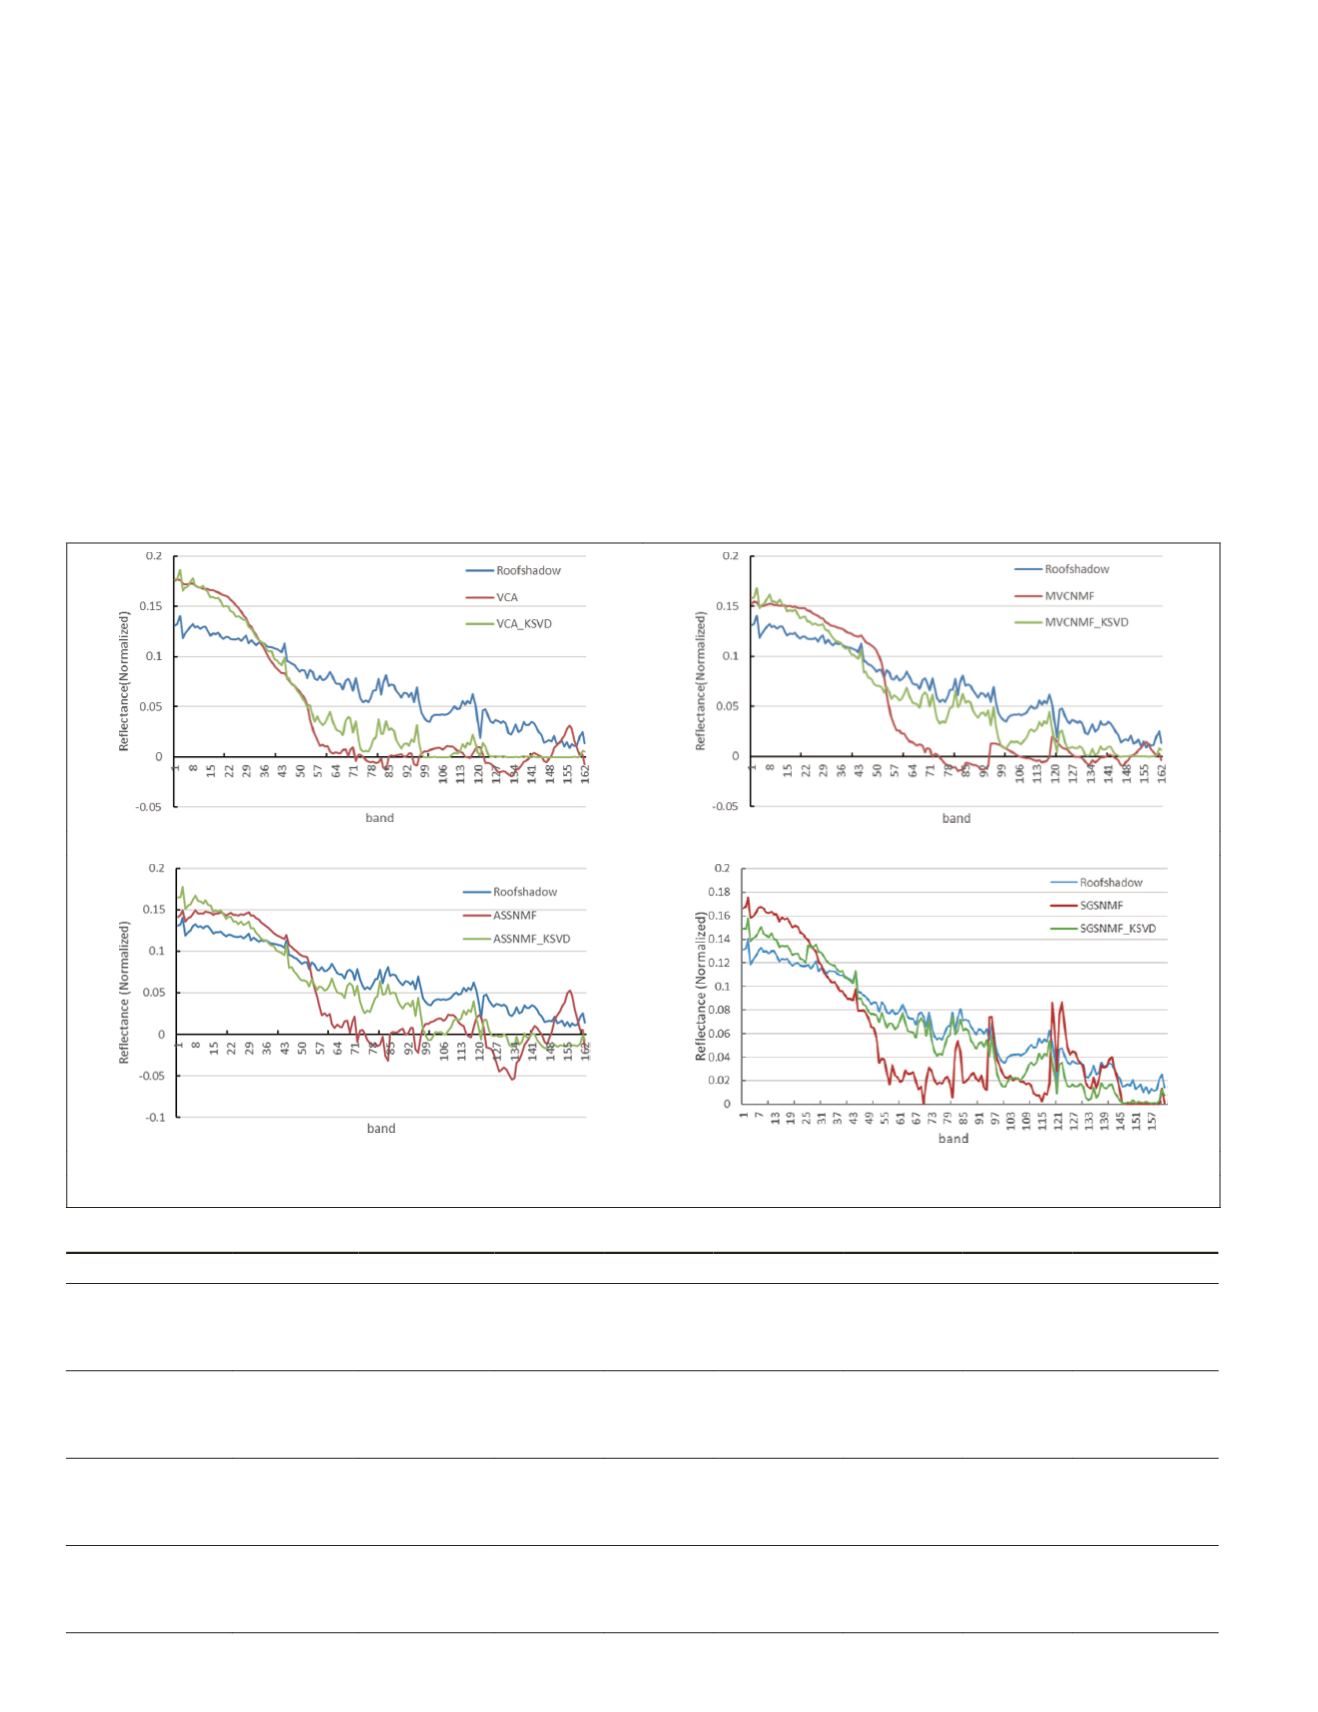
Figure 4 shows the
K-SVD
optimization method outperforms
the original methods, for example, with the roof feature. The
curves extracted by optimized methods are very close to the
reference roof curves. The
ASSNMF
_
KSVD
result is the closest
to the roof curve, and it achieves the overall optimized degree
by 53.0% (from Table 3).
From Table 3, after the optimization of four methods:
VCA
,
MVCNMF
,
ASSNMF
, and
SGSNMF
achieve the maximum optimi-
zation on Road. The Road’ D-values obtained by four methods
are 0.2592,0.3242,0.3356, and 0.6205, respectively. For the
optimized
ASSNMF
, it narrowed down the
SADs
of Roof from
0.2239 to 0.0079, Road from 0.4869 to 1513, and achieved the
best optimization among four methods in Pavia dataset.
Table 3 is the
SADs
between reference spectrum and extract-
ed spectrum of the Pavia dataset calculated by
VCA
,
MVCNMF
,
ASSNMF
, and
SGSNMF
, before and after optimization. The mean
SAD
of
VCA
decreases from 0.2598 to 0.1526, and overall op-
timized by 41.3%. The mean
SAD
of
MVCNMF
decreases from
0.2456 to 0.1337, and overall optimized by 45.5%. The mean
SAD
of
ASSNMF
decreases from 0.1960 to 0.0921, and overall
optimized by 53.0%. The mean
SAD
of
SGSNMF
decreases from
(a) VCA_KSVD
(b) MVCNMF_KSVD
(c) ASSNMF_KSVD
(d) SGSNMF_KSVD
Figure 3. Comparison of the extracted Roof shadow using the optimized methods with the standard curves in Urban dataset.
Table 2.
SADs
between reference spectrum and extracted spectrum using four methods before and after optimized on Urban dataset.
Endmember
Asphalt
Concrete
Grass
Roof
Shadow
Tree
Mean
Overall, %
VCA
before
0.1523
0.3625
0.0931
0.1740
0.5860
0.0472
0.2359
25.6
after
0.0904
0.2561
0.0801
0.1060
0.4540
0.0656
0.1754
D-value
0.0619
0.1064
0.0130
0.0680
0.1319
-0.0183
0.0605
MVCNMF
before
0.1455
0.2722
0.0880
0.1480
0.5454
0.0319
0.2052
38.5
after
0.0632
0.2261
0.0681
0.0574
0.2561
0.0854
0.1260
D-value
0.0822
0.0462
0.0199
0.0906
0.2893
-0.0535
0.0791
ASSNMF
before
0.2399
0.2885
0.1229
0.1509
0.5766
0.0496
0.2381
45.4
after
0.0667
0.2158
0.0719
0.0799
0.2515
0.0939
0.1300
D-value
0.1731
0.0727
0.0510
0.0709
0.3252
-0.0443
0.1081
SGSNMF
before
0.3273
0.1964
0.2338
0.1760
0.4059
0.1258
0.2442
55.7
after
0.0964
0.1429
0.0985
0.0732
0.1720
0.0668
0.1083
D-value
0.2309
0.0535
0.1353
0.1028
0.2339
0.0590
0.1359
884
December 2019
PHOTOGRAMMETRIC ENGINEERING & REMOTE SENSING


