0.4231 to 0.2542, and overall optimized by 39.9%. In
VCA
, all
species except the water are optimized to varying degrees. As
the water achieves the smallest
SAD
before the optimization,
so the precision slightly decreased after the optimized.
Figure 5 shows the optimized methods’ results are supe-
rior to the original methods, such as the extracted results of
Nontronite. The
KSVD
based methods’ curves are closer to the
standard Nontronite curves than the original method curves.
Table 4 is the endmembers of Cuprite dataset precisions of
VCA
,
MVCNMF
,
ASSNMF
, and
SGSNMF
, before and after optimiza-
tion. Endmembers 1 to 10 denotes Alunite, Andradite, Bud-
dingtonite, Dumortierite, Kaolinite1, Kaolinite2, Muscovite,
Nontronite, Pyrope, and Chalcedony, respectively. The overall
accuracy of
VCA
,
MVCNMF
,
ASSNMF
, and
SGSNMF
increased by
15.3%, 17.7%, 15.8%, and 15.1%, respectively. From Table
4, the overall accuracy is improved by about 15.1% to 17.7%.
However, for optimized
VCA
,
MVCNMF
, and
ASSNMF
, Alunite
and Pyrope are not improved.
SADs
of Buddingtonite and Py-
rope in optimized
SGSNMF
are slightly increased. The reason
is the same for the experiments of Urban and Pavia dataset,
that the objective function is set to be overall optimal, so in
the iterative process, endmembers are optimized gradually.
The overall value indicates the accuracy increase rate after
the optimization. From Tables 3, 4, and 5 the endmembers in
different datasets estimated by four methods before and after
optimized are improved in different level, and the overall
value is from 15.1% to 55.7%. For Urban dataset, the highest
overall value 55.7% is achieved by
SGSNMF
; for Pavia dataset,
the highest overall value 53.0% is achieved by
ASSNMF
; for
Cuprite dataset, the highest overall value 17.7% is achieved
by
MVCNMF
. Since the proposed method is based on singular
value decomposition of the error matrix, the difference be-
tween the product of the obtained endmember and abundance
and the original image is gradually reduced. The Cuprite
dataset has a complex spectrum, and the image contains more
than ten features, so the optimization effect is not as good as
the other two sets of data.
(a) VCA_KSVD
(b) MVCNMF_KSVD
(c) ASSNMF_KSVD
(d) SGSNMF_KSVD
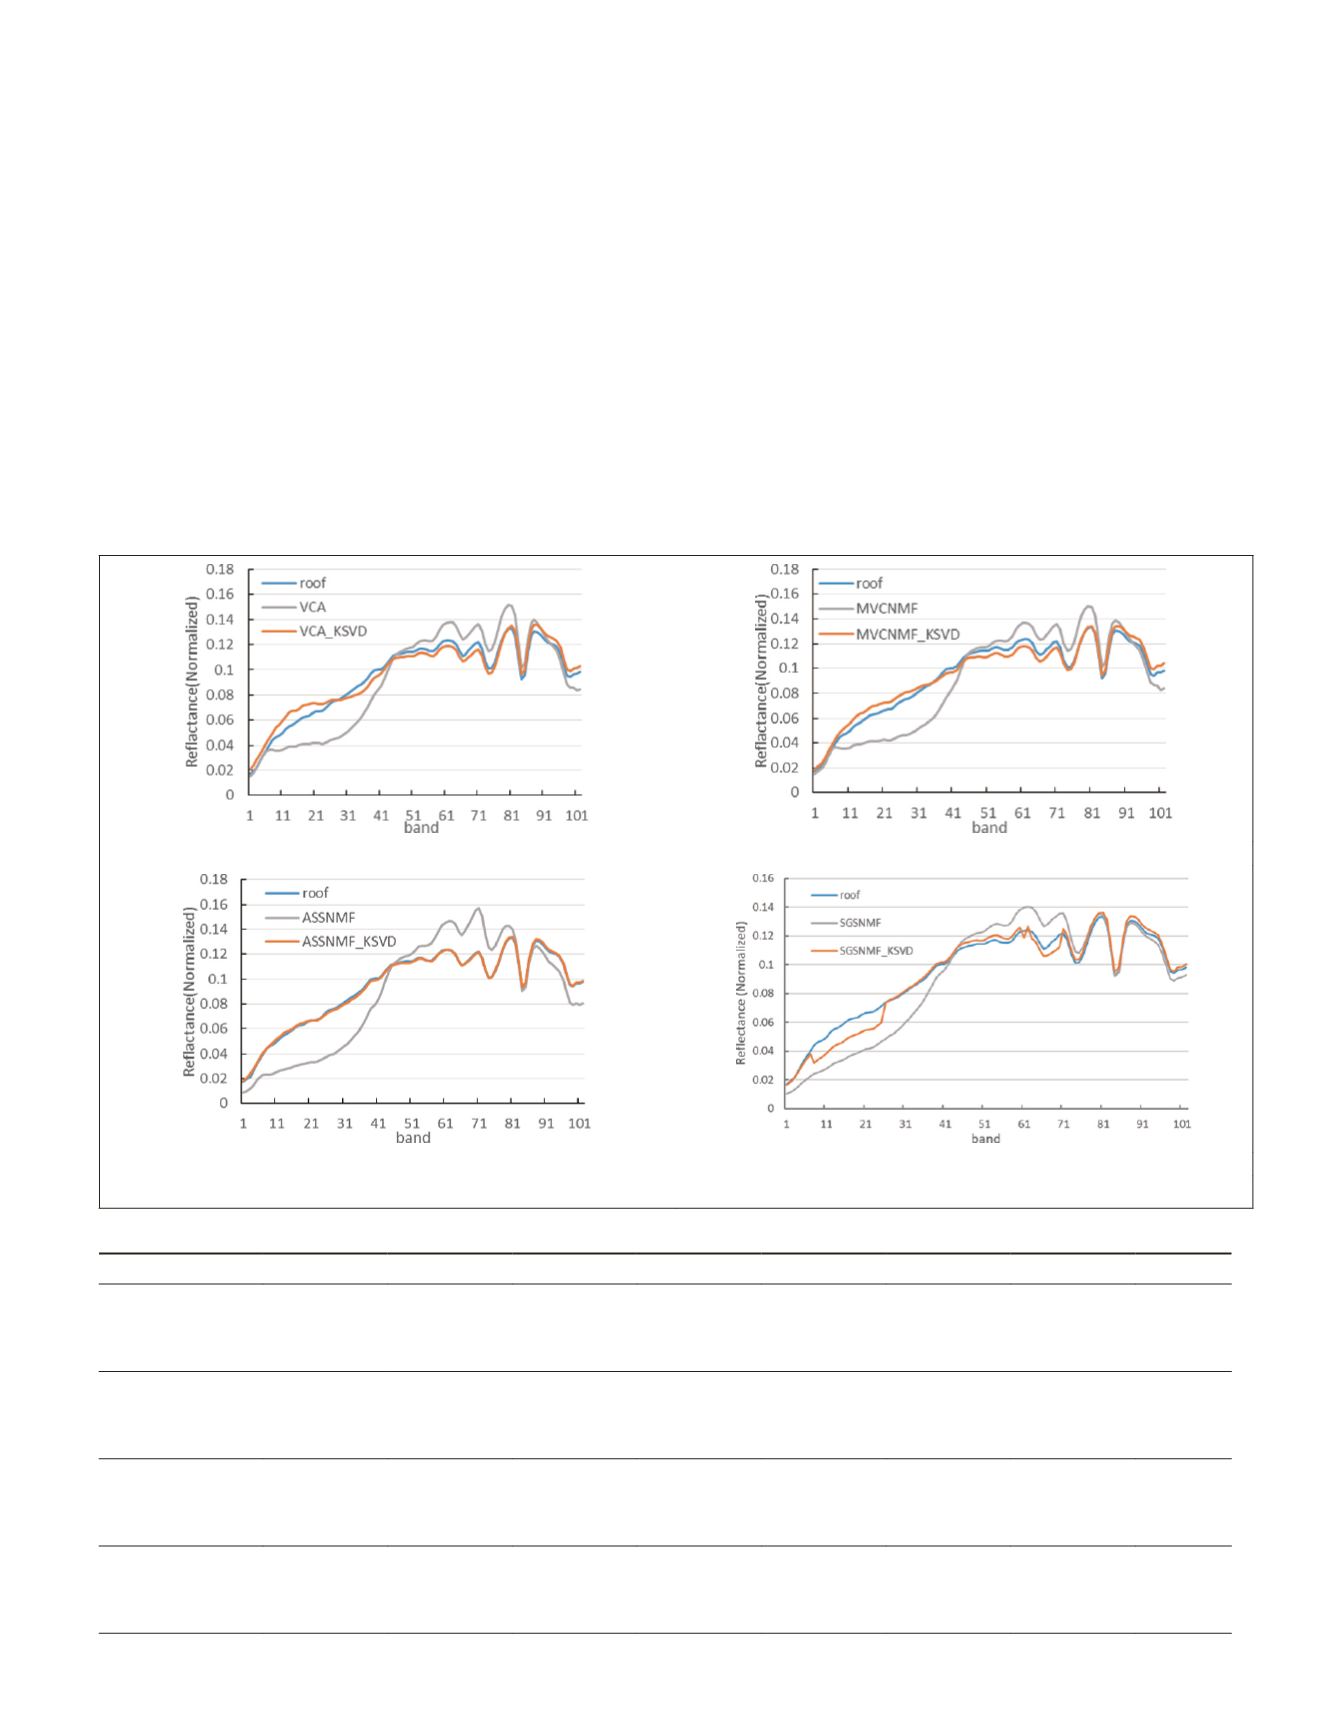
Figure 4. Comparison of the extracted Roof using the optimized methods with the standard curves in Pavia dataset.
Table 3.
SADs
between reference spectrum and extracted spectrum using four methods before and after optimized on Pavia dataset.
Endmembers
Grass
Path
Road
Roof
Tree
Water
Mean Overall, %
VCA
before
0.1566
0.4193
0.5952
0.1606
0.0905
0.0533
0.2598
41.3
after
0.0775
0.3309
0.3360
0.0355
0.0690
0.0666
0.1526
D-value
0.0791
0.0884
0.2592
0.1250
0.0215
-0.0132
0.1072
MVCNMF
before
0.1566
0.4186
0.5948
0.1603
0.0900
0.0534
0.2456
45.5
after
0.1234
0.2986
0.2706
0.0434
0.0360
0.0304
0.1337
D-value
0.0332
0.1199
0.3242
0.1169
0.0540
0.0230
0.1119
ASSNMF
before
0.0360
0.3096
0.4869
0.2239
0.0230
0.0968
0.1960
53.0
after
0.0368
0.2463
0.1513
0.0079
0.0443
0.0661
0.0921
D-value
-0.0008
0.0633
0.3356
0.2160
-0.0213
0.0307
0.1039
SGSNMF
before
0.3652
0.2753
0.6753
0.6249
0.3213
0.2770
0.4231
39.9
after
0.3453
0.2730
0.0547
0.5540
0.2292
0.0690
0.2542
D-value
0.0199
0.0022
0.6205
0.0709
0.0922
0.2079
0.1689
PHOTOGRAMMETRIC ENGINEERING & REMOTE SENSING
December 2019
885


